

When I started blogging in 2014 most bloggers generated their income from advertising and affiliates. Business models were simple and homogeneous. The bigger you were, the more income you could generate and you were usually, simply, a blogger.
Fast forward to today and 77 million new blog posts are published every month on WordPress, which supports around a third of all the websites that exist.
As the industry exploded, social media matured and blogging became more sophisticated, so did the variety of business models and their complexity.
If you asked 10 Content Creators about their business models today, there would probably be 10 different answers.
Since starting Once in a Lifetime Media, our Digital Media and Influencer Marketing practice, in 2017, we have seen clients (mostly travel brands brands) and Content Creators evolve.
Both have become more savvy and have at their disposal more tools to support their business, from marketplaces to softwares for spotting fake followers and anything in between. There are also many more ways to make money travel blogging which have provided new opportunities.
Likewise, the type of Brand-Content Creator collaborations we worked on in 2019 are very different from the straightforward sponsored post campaigns we started with.
As the content creation industry matured, we felt a need to back hypothesis with data.
While there are several surveys and industry reports that highlight challenges and opportunities from the perspective of a brand (mostly carried out by influencer marketplaces), there are far fewer and much higher-level industry reports that talk about the Content Creator world.
It was this increased level of sophistication and the lack of detailed industry reports that led us to launch the 2019 Professional Content Creator Survey in partnership with KAYAK Affiliate Network.
The survey aims to shed some light on global trends and answer a few burning questions from brands and Content Creators:
- What an average content creator looks like (not from an average composite). Is it the young, tanned, white, female, digital nomad the media often portrays in influencer articles or an experienced online entrepreneur who has switched careers and works out of a fixed home office?
- A typical day at the office. What are the hours like and how long and hard can a new Content Creator expect to work? What is the minimum amount of content/hours/articles/following/traffic needed to generate significant revenues?
- What the revenue model looks like. What are the main sources of revenue for Content Creators? What are the revenue drivers?
- Industry rates. How much do Content Creators charge? Does the barter system still prevail?
- Brand collaborations. What rates can a brand expect to pay? What do Content Creators value? What happens during and after a campaign ends? Do results get amplified?
- The business side of blogging. Disclosures, reporting and analytics.
- Sentiment and forward-looking view on the industry.
Main take-aways from the 2019 Professional content creation Survey
- The industry has professionalised. Successful Content Creators are experienced (37 years old on average), small online business owners who work long-hours from home (78%), for themselves and excel at a range of skills.
- Content creation is a financially viable career choice. 10% of the respondents generated more than $10,000 monthly consistently in the last 6 months. 20% of the respondents generated an income in the top-50% percentile of the US population.
- There are as many business models as there are Content Creators. But the key drivers of revenue of the most financially successful ones are similar: diversification, passive income, internal tracking.
- To break into the higher revenue levels requires a mastery of passive income, in particular of Affiliate revenues. However, many pain points and learning opportunities remain. Brands who are serious about having a play should devote resources into supporting small businesses in a scalable manner.
- Post-campaign reporting is not a widely spread best practice. There are opportunities for Content Creators to maximize the value of campaigns for themselves and for brands.
- Brands are not maximizing the potential of a campaign. Money is left on the table for not properly aligning objectives and deliverables to make the most of every brand collaboration. Amplification of results is not a widely established practice and 51% of the brands do not repurpose content of a campaign at all.
- Disclosure is a hot topic known and understood by 77% of Content Creators but not always followed.
- Despite the industry becoming more competitive, Content Creators have a positive outlook on the future: 2020 will be more professional, more competitive but also more successful.
About the 2019 content creation Survey
The 2019 Professional Content Creator Survey ran from the beginning of December until just before Christmas and collected just under 200 valid responses.
Each respondent spent close to 15 min filling a 60-question form with a combination of open-ended questions, with others that were Yes/No or multiple-choice.
The first 30 people to fill in the survey were rewarded with a 30 EUR voucher from HotelsCombined courtesy of the survey sponsor, KAYAK Affiliate Network (KAN).
The survey was promoted via our mailing list and the various global industry groups we are a part of (the majority of which are in the travel niche, hence the bias in the sample) and have a degree of business/monetization focus (hence the higher level of professionalization in the sample).
Editor’s note: unless otherwise stated, all figures shared in this report are in USD and extracted from the 2019 Professional Content Creator Survey.
What is a Content Creator
When setting up the survey, we had to pick a word to define the survey respondents and we decided to use the term “Content Creator” to group bloggers, Instagrammers, Influencers, YouTubers, writers, online publishers, independent online publishers, etc. under a common profession.
We chose this term because all of the above have one thing in common: they create online assets, be it in writing, photography or videography (or all of them), albeit they do so in varying shapes and forms.
Our respondents all had something else in common: They monetised these skills via their online platforms, either on social media or via their own publication.
We decided against using the term Influencer because it is a tainted one, despite being an old concept coined online for almost 15 years (as this article from WIRED explains), and despite being a term that brands continue to use. The majority of our sample does not identify with it either.
Click-bait articles with headlines along the lines of “So and so makes [6 figure income] traveling the world” have attracted the general public’s attention and online searches for the term have skyrocketed tenfold since 2016 according to Google trends.
Articles talking about how to make money as an influencer on Instagram, Influencer marketing courses and even retreats or workshops abound. Everyone wants to get on the bandwagon.
The term Influencer is overused (even the Pope called the Virgin Mary “the largest Influencer of all time” in a tweet) and it is something outsiders aspire to (even racking up debt to emulate), but many insiders work hard to stay away from.
We felt Content Creator better reflected the business model of our sample.
Who the Content Creators in our sample are
Who are the Content Creators in this survey?
Unsurprisingly, given the focus of this website, our digital media practice and the groups we are a part of, the vast majority of the answers came from travel Content Creators (88%) publishing in English (96%).
The language split is above the average for the websites online (71% of WordPress sites are written in English). English has become the language of the internet, thus it is a much more competitive language to write in too.
Our respondents were not new bloggers. The average age of their business was 5.8 years, indicating that they have experience and also have had the time to experiment with various business models.
This was also consistent with the age of the Content Creators themselves (37.5 on average) as well as with their income distribution. Below is a histogram that shows the distribution for the age of the businesses:
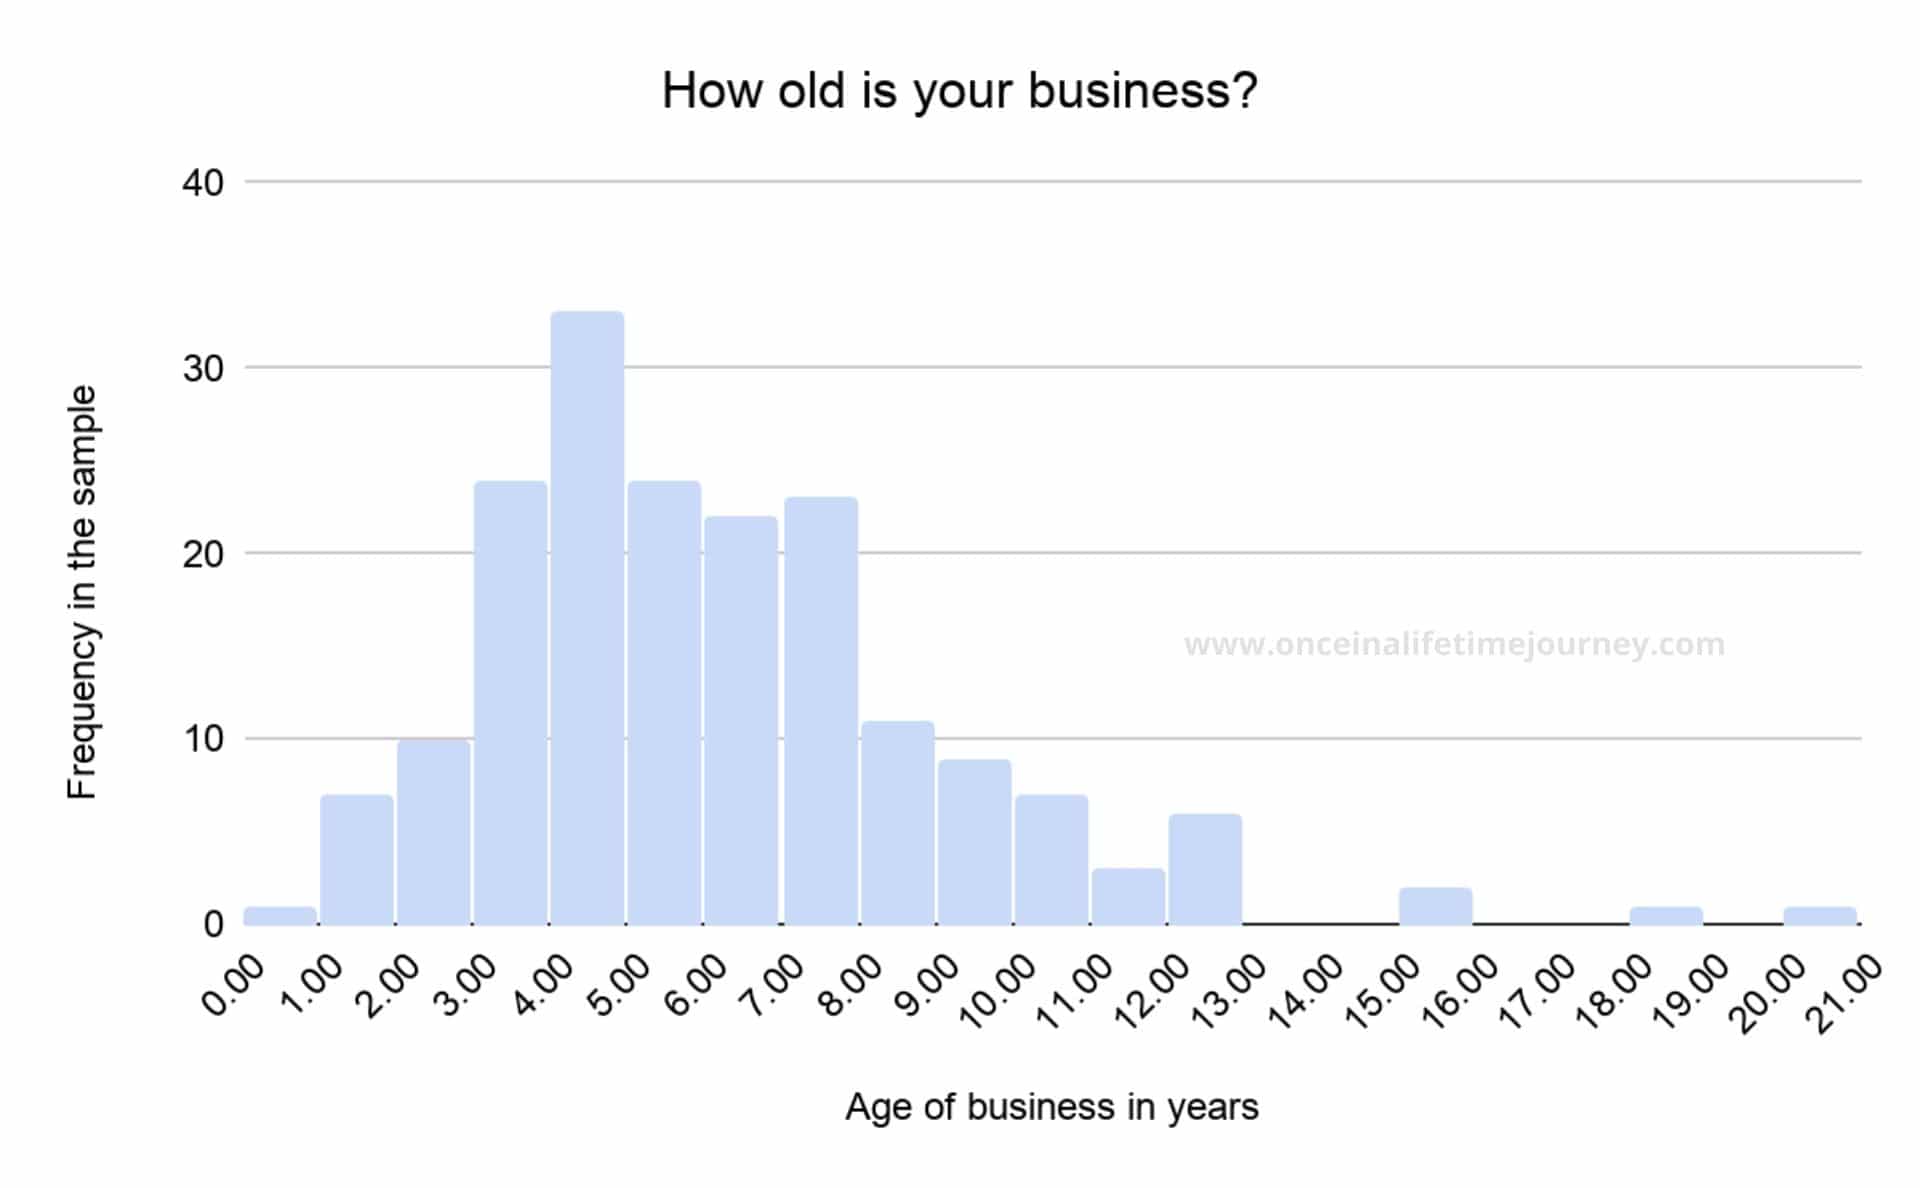
Besides having a large concentration of Content Creators around the average age, there are also some younger and older Content Creators in the mix.
Gender split
86% of the Content Creators who participated in this survey were women.
This gender split is not necessarily representative of the content creation industry as a whole, though it is not far from it. The industry is dominated by women for several reasons, but not in this extreme proportion.
Anecdotally, we know that this higher-than-usual female percentage is the result of the traditional split of tasks in the cases of couple bloggers (of which there were many in the sample) where social media tasks are taken care of by the woman.
Thus, it would be fair to assume that female answers represent single female Content Creators as well as couple Content Creators.
Age of the Content Creators
Besides gender, respondents were on average 37 years old, in relationships or married in 77% of the cases, and 69% worked full time as Content Creators.
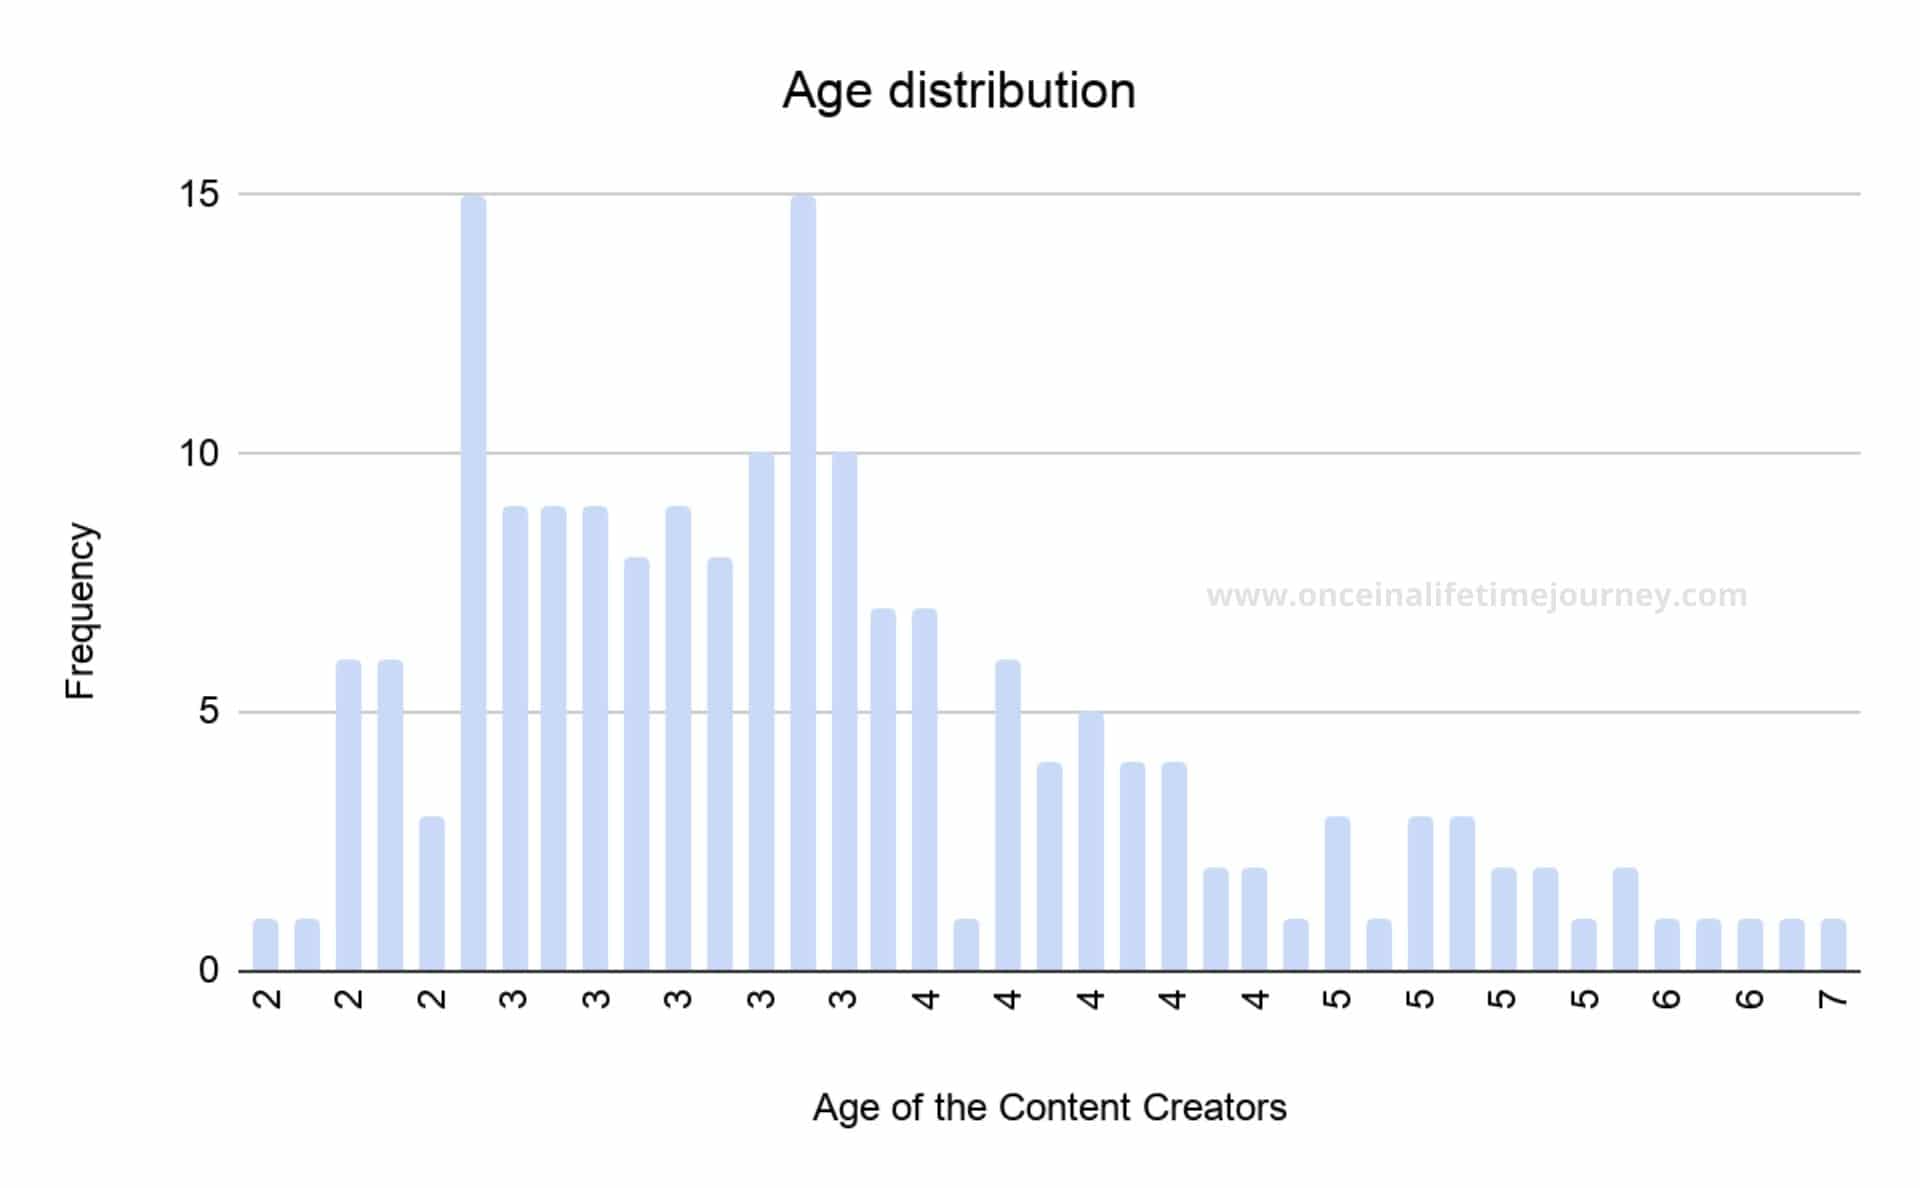
The age distribution of our sample shows that Content Creators come in all ages. In fact, 31% of the answers came from Content Creators who were 40 years old and above.
Digital nomads or online entrepreneurs?
Perhaps the most surprising find is that 78% of the respondents have a fixed address, instead of being digital nomads.
This would go against the common belief that Content Creators are always on the move, especially in the travel niche, but supports the fact that there is an increased number of professionals who choose content creation as a long-term career.
As someone once said to me, being a travel blogger is, in a way, an oxymoron because you are either blogging or traveling but doing both things at the same time with a degree of financial success is very difficult (albeit not impossible as many cases demonstrate).
Working hours
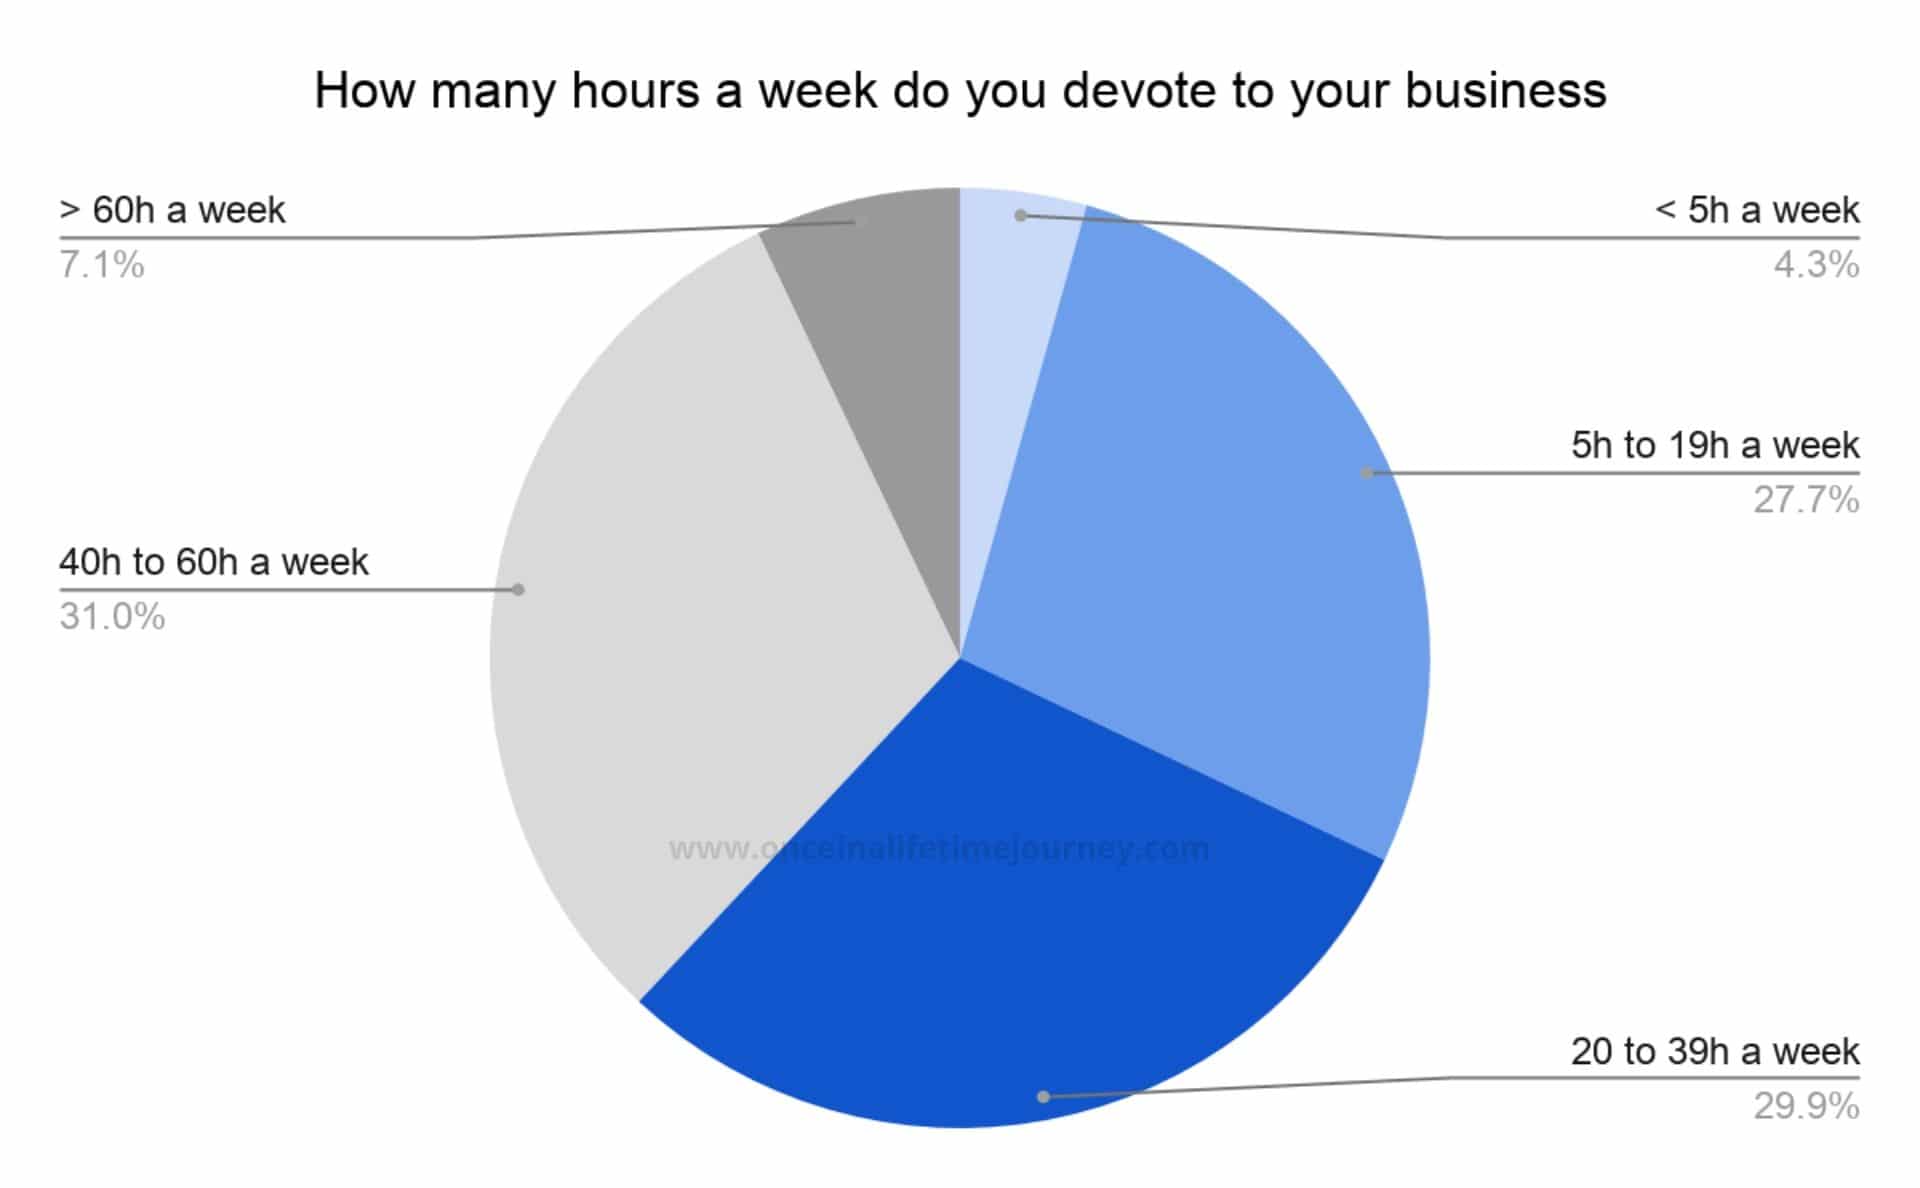
Of those working full-time, about 30% devoted between 20 and 40 hours a week to their online business and 32% between 40 and 60 hours per week. Only 11% worked less than 20 hours a week.
This would debunk the misconception that most Content Creators left 9 to 5 jobs to work less. On the contrary, as most entrepreneurs would attest, the choice is not usually to work less but to do what we love with more flexibility (and in our pajamas, many would argue).
Online presence
We use the term Content Creators to group everyone but given the source of our sample, we knew that blogging would be a main revenue source or our respondents and we were not wrong.
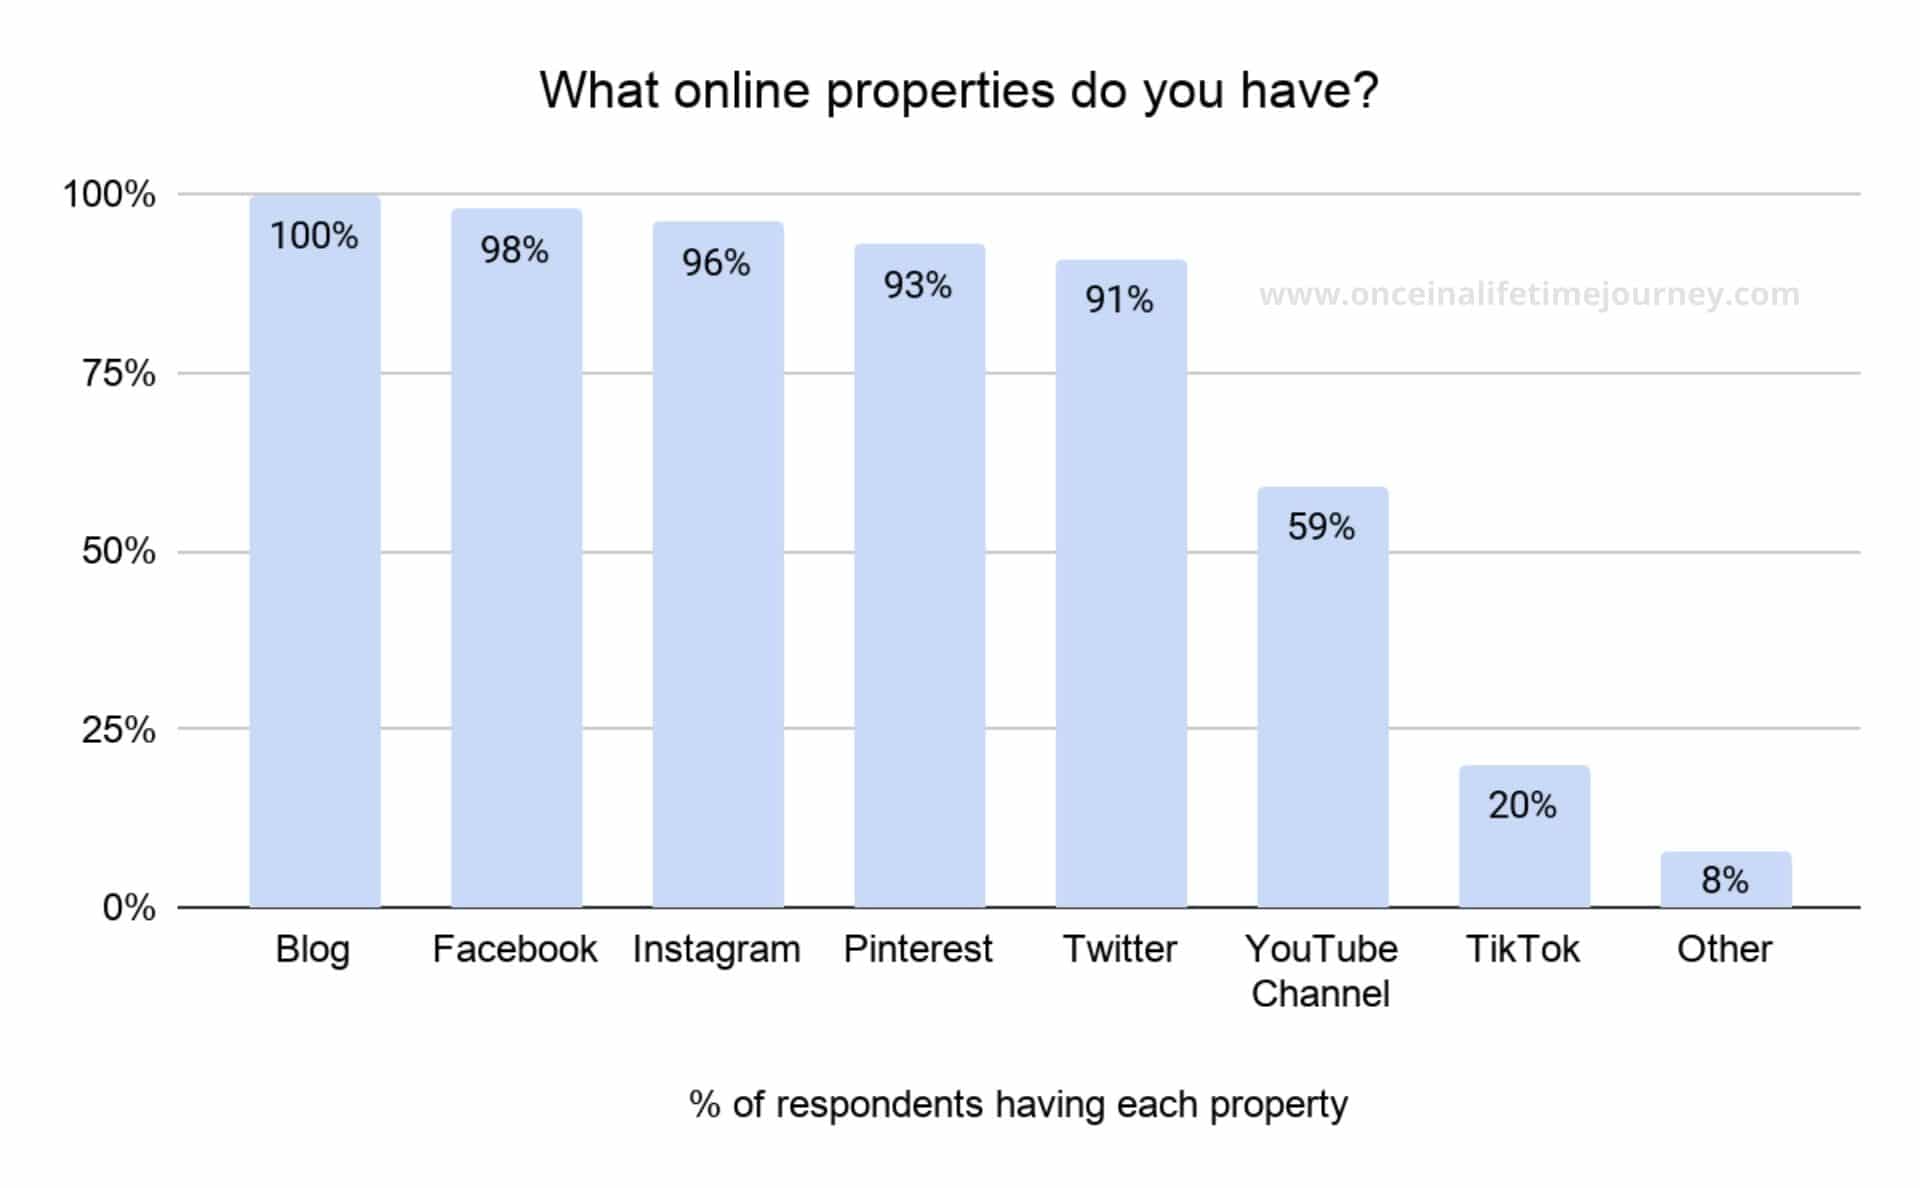
All of the respondents had a blog, in addition to having a Facebook page in 98% of the cases and an Instagram account in 96% of them.
On the other hand, only 58% had a YouTube channel and 20% a TikTok account. It will be interesting to see the evolution of these figures, especially as TikTok enters the Content Creation and monetization space now that it is a widely spread service.
How do you introduce yourself?
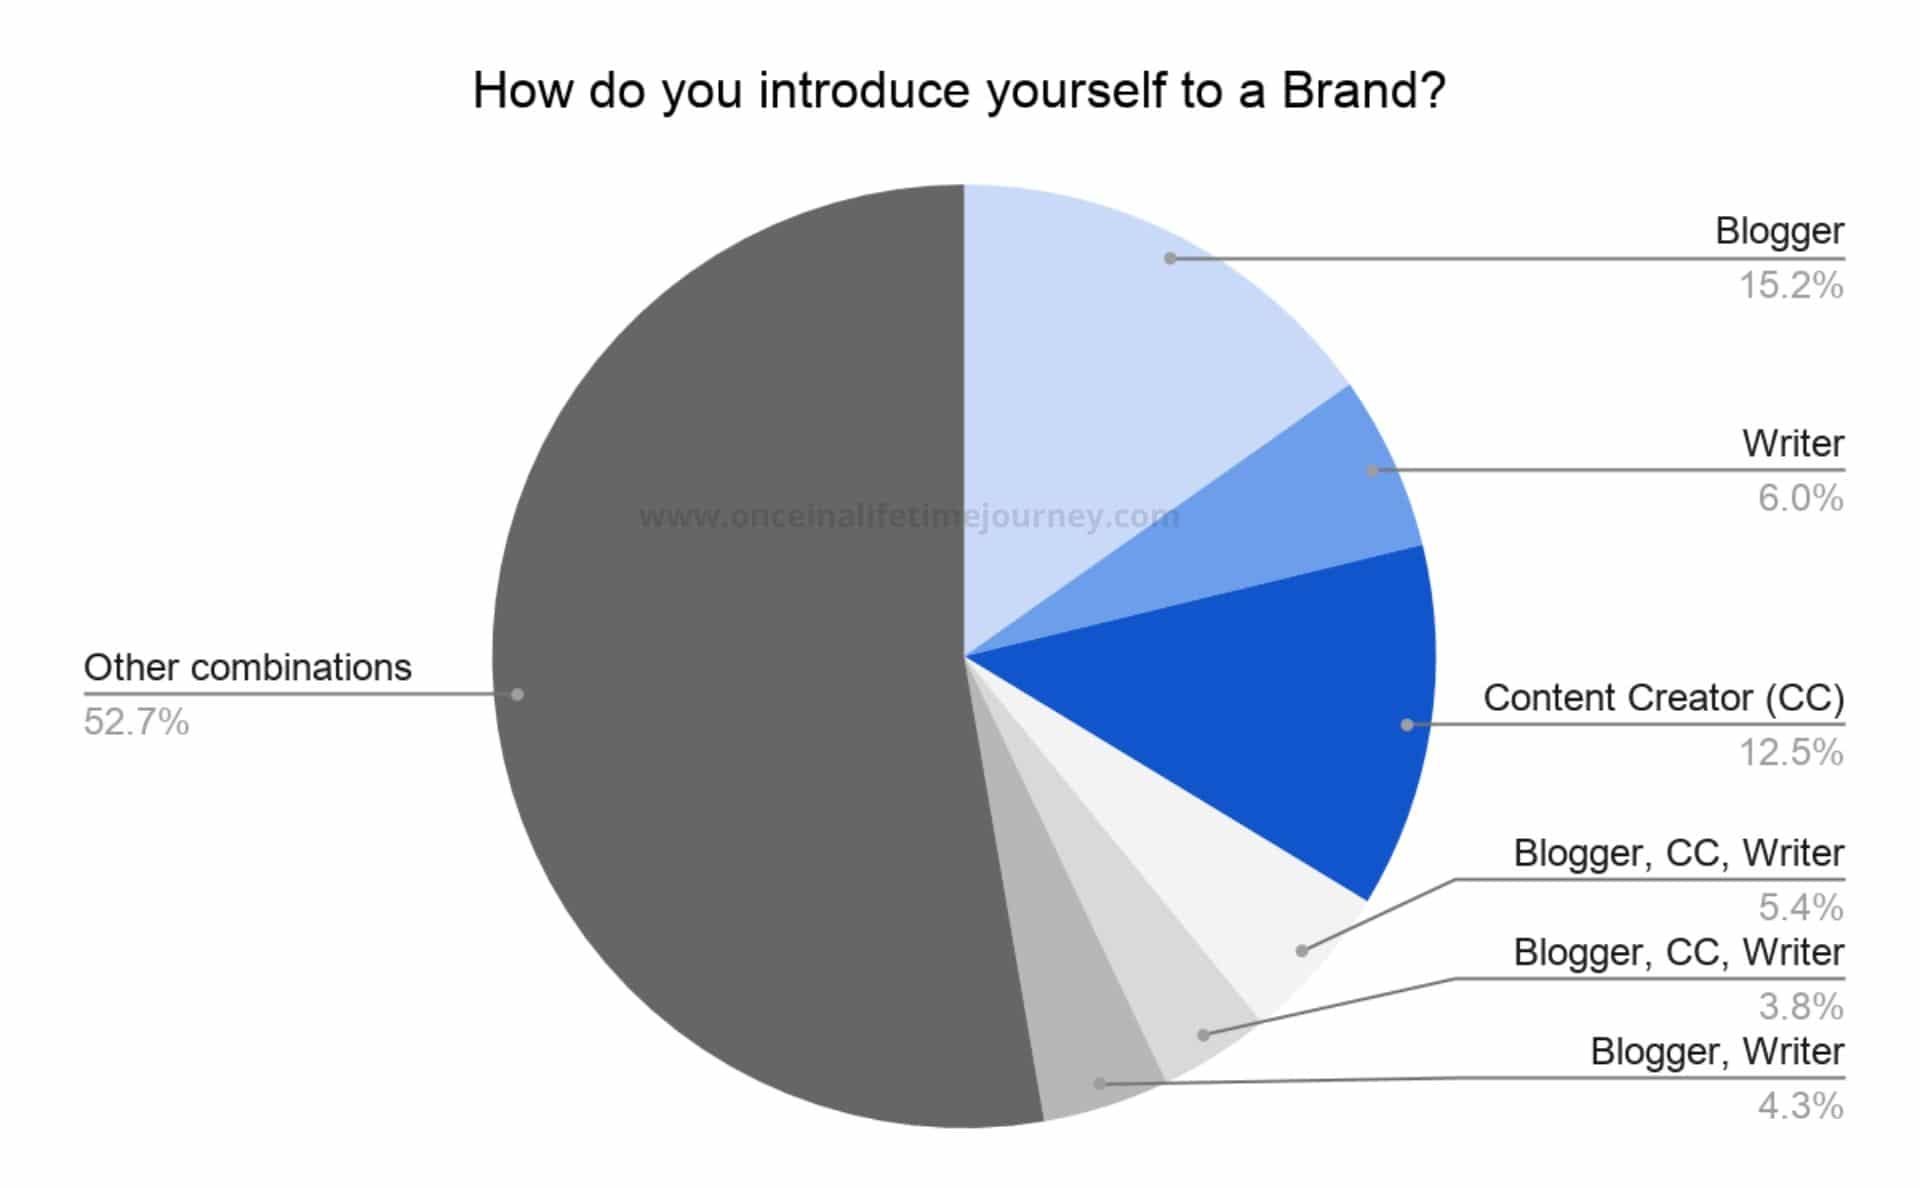
When asked how they introduce themselves when meeting a brand, 15% said they are Bloggers, 13% Content Creators and 6% Writers.
The majority (66%) introduce themselves using more than one adjective, be it Blogger, Writer, Content Creator, Influencer, Photographer, Publisher, etc. This alludes to the complexity of the industry and the many hats most Content Creators wear.
While, in the traditional print business, there are various departments taking care of the different aspects of a publication (publishing, editorial, photography, marketing, sales, finance, etc.), blogs require an individual or couple to handle all these various roles at once.
To excel in the independent online publishing world, you must at least be knowledgeable in several of these areas and able to outsource those you are not an expert in.
Business models
Although SEO-driven content creation is becoming the norm, there are various business models thriving and coexisting in the sample of answers.
I mentioned that all the Content Creators in this survey have their own blog and that the majority have Facebook and Instagram, but let’s look at other aspects of the business model.
How much money do Content Creators make?
One of the most common questions beginner Content Creators (and those considering to enter the industry) ask is, how much can one generate through blogging. This was one of the main areas of study in this survey.
Before we delve into the numbers, it is worth remembering the socio-economic averages of our sample: the age of the blogs and the Content Creators themselves, the revenue distribution and the self-selection in the sample size which most likely excludes hobby bloggers.
As a reminder, this survey was completed by Content Creators who were either part of our database of over 1,000 we have worked with in various campaigns and brand collaborations, or of the various professional Content Creator groups we are a part of.
In both cases, this means they have an understanding of the possibilities of monetizing their online presence and are attuned to the business of blogging. This becomes apparent in the revenue split.
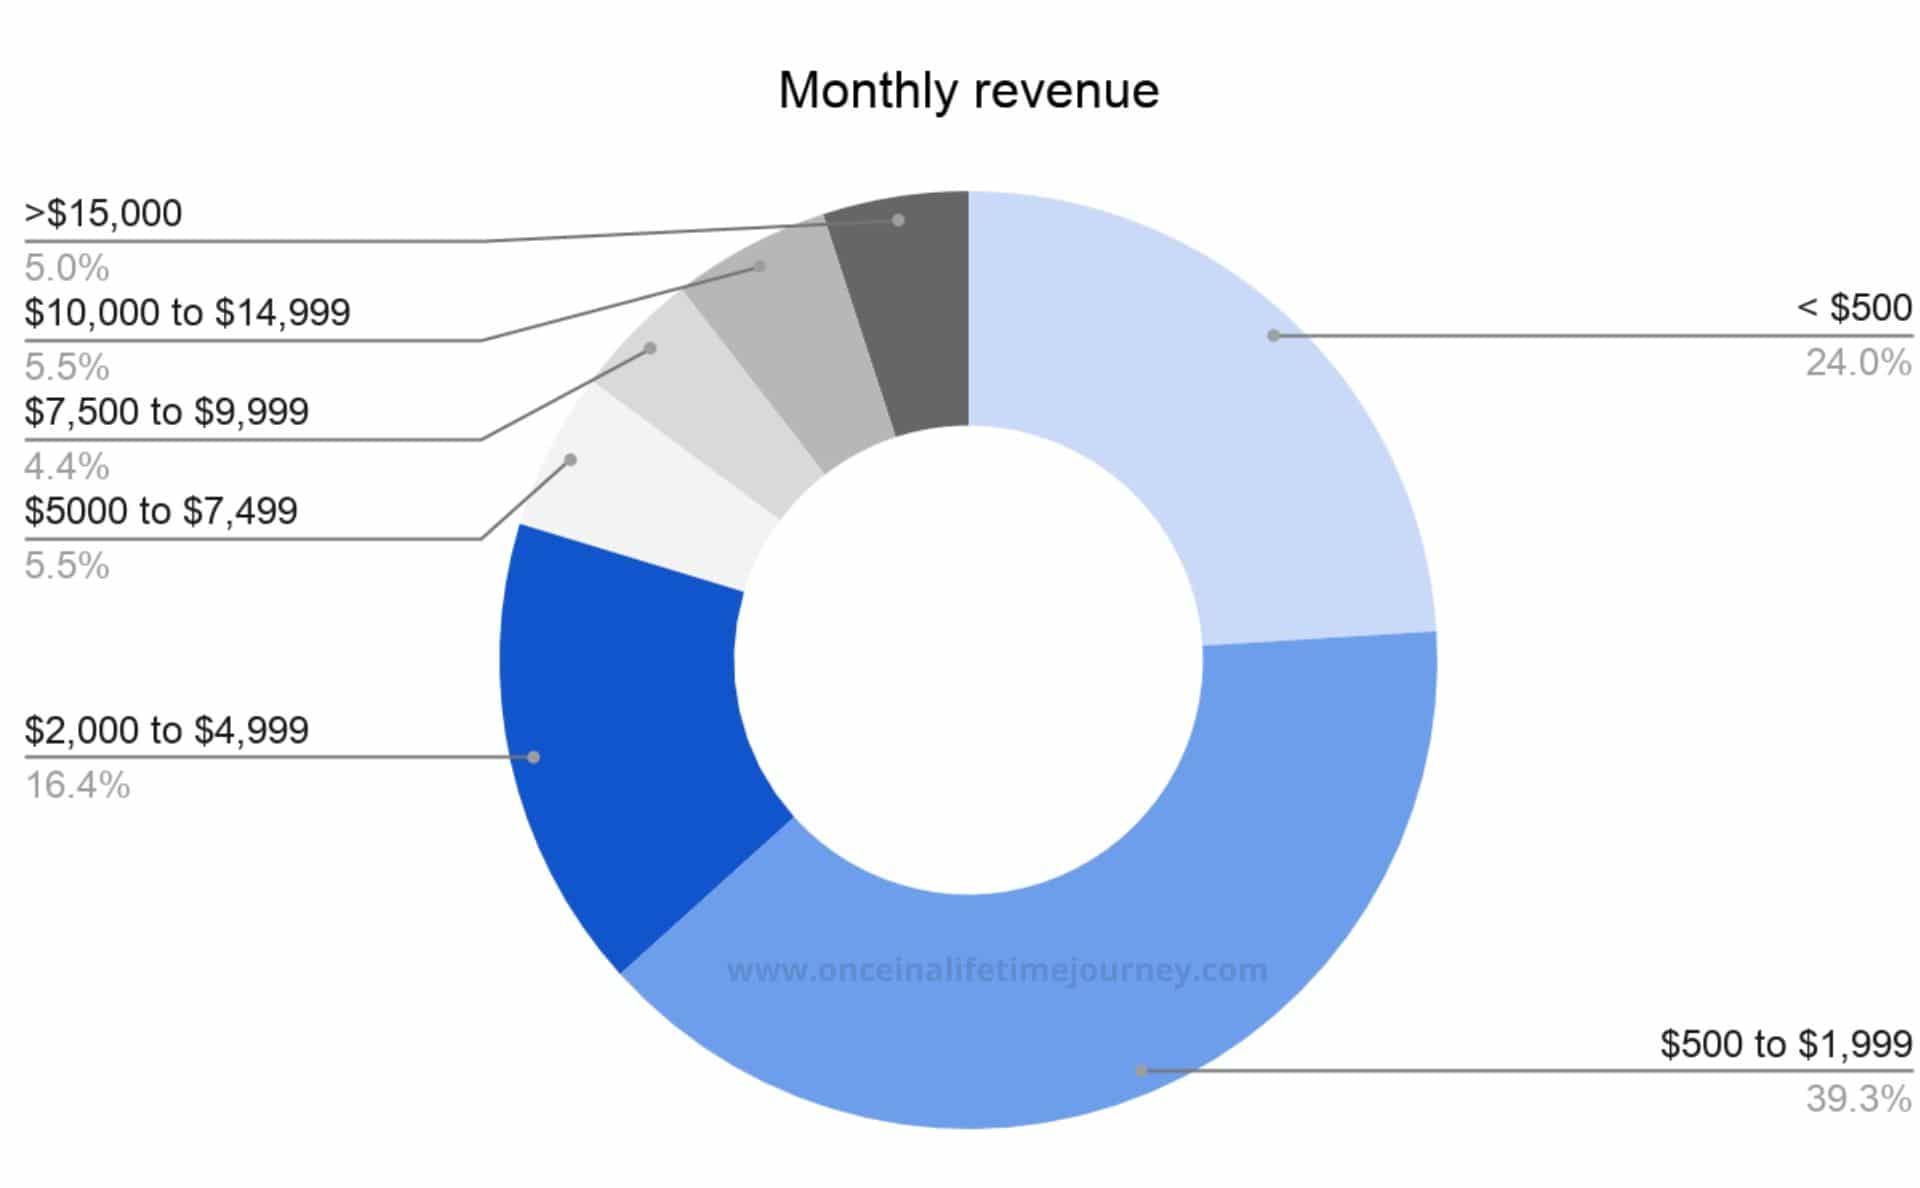
16% of the Content Creators in our sample make what would be considered an average salary in many Western countries, between $2,000 and $5,000 per month and only 24% make less than $500. The latter could be considered hobby bloggers or could be starting out.
On the upper end of the spectrum, around 10% of the sample generates more than $10,000 a month. We will look at these in more detail later on but suffice to say at this point that these high earners making $120,000 a year would be in the 5% to 10% top percentile of earners in the US.
Even those making between $2,000 and $5,000 a month would be in the 30% to 50% percentile of earners in the US.
Whoever thinks blogging or content creation is not a financially valid long-term career choice may not understand the industry’s potential and legitimate revenue drivers.
Sources of revenue
In the survey, we asked respondents to not only indicate how much they made but also how this revenue was generated.
There were then several questions around this, starting with “Where did your revenue come from in the last 6 months?”.
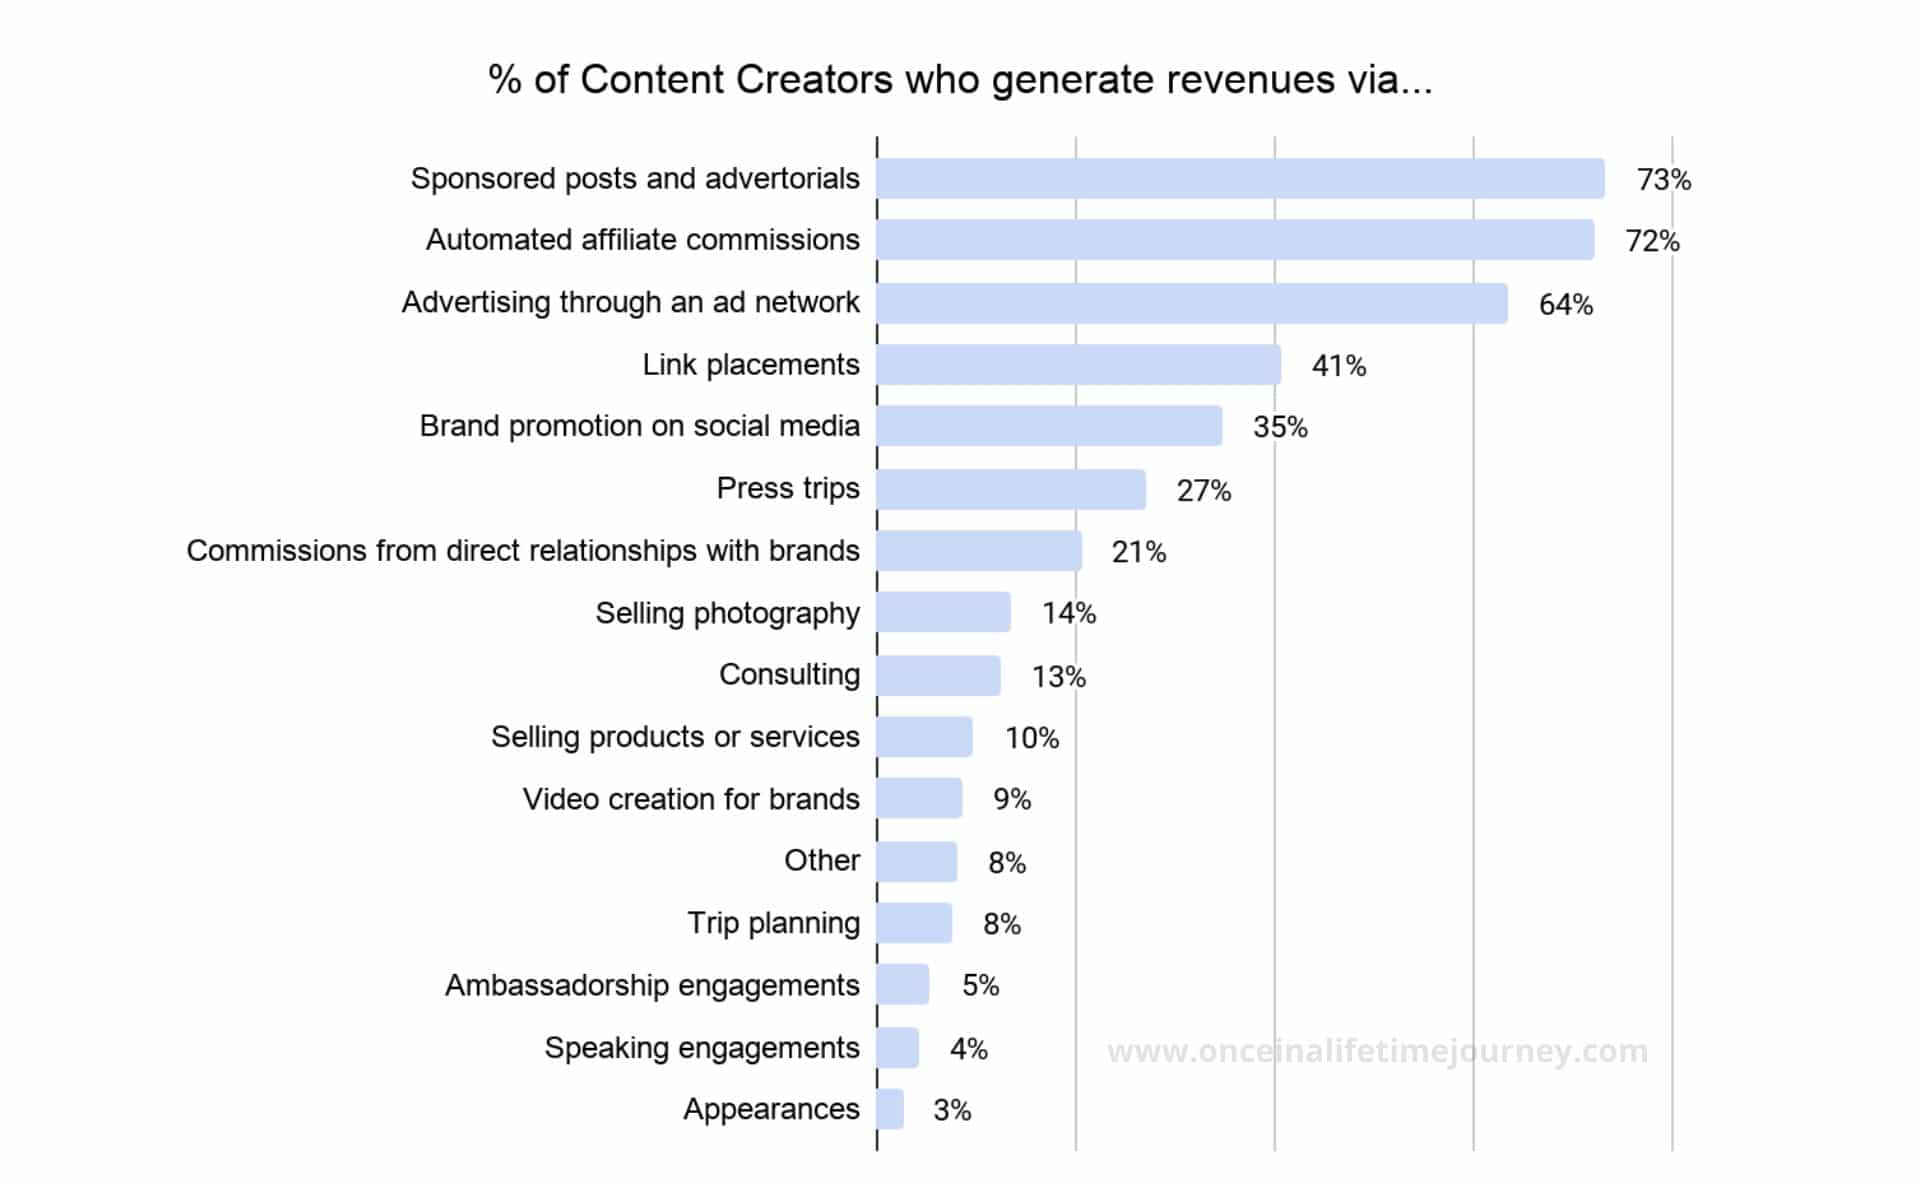
The majority of Content Creators generated income in the last 6 months via sponsored posts, affiliate commissions and advertising.
The importance of sponsored posts is unsurprising since this is a carryover from the print world and a typical way to promote a brand that existed before influencer and social media marketing.
This is also the most common way brands engage with Influencers according to the 2019 Influencer Marketing survey by Activate.
Despite Google’s repeated attempts at penalizing those who sell links, 41% of Content Creators still drew revenues this way.
This is because it is easier to grow Moz Domain Authority (the most common industry reference used by link building companies to determine the value of a website’s link), than to grow the traffic and other passive income streams. So this is often the first and easiest way for a blogger to make money.
And we know, from a previous study we conducted, that there is not necessarily a correlation between Domain authority and traffic.
In the sample, only 35% of the Content Creators generated an income via social media promotion, indicating that there is a small proportion of Influencer-only respondents in our sample and that it is becoming harder to monetize this channel.
However, this is the most widely publicized and aspirational revenue source for many. The “Get paid to travel the world” headline still attracts an audience of curious and slightly voyeuristic readers who are fascinated by the new professions created by social media. And has a monthly worldwide search volume of over 8,000 on Google.
On the other hand, only 27% of the respondents made money via press trips. Most press trips are unpaid and fewer Content Creators are keen to join them without payment, particularly those who are experienced and understand their worth. We will look at this more in detail later.
Product or service selling is still a relatively unexplored area. Only 14% of the respondents sell their services, either photography (an obvious by-product of any blogger, influencer or content creator’s day-to-day job) and 9% video creation for brands.
The small percentage of Content Creators selling their services might increase in the future as growing a social media following becomes harder and brands start to recognize the value of pure Content Creators (without a large distribution channel) over expensive production companies.
Passive vs. active revenue streams
We like to obsess over passive income and we are not the only ones. It is the only way to scale small entrepreneurial endeavours while maintaining sane working hours.
From the graph in the previous section we wanted to draw the attention towards the importance of passive vs. active income.
We define passive income as a type of revenue that would be generated if the Content Creator took a month off. It is off-hands and usually comes with regular traffic.
On the other hand, active income streams, for example a sponsored article or a social media post, require the Content Creator’s input.
Of the top-5 sources of revenue, three are active (sponsored posts, link placements and social media promotion) and two are passive (affiliates and advertising). As building enough traffic to generate sufficient passive income takes time, the other sources take importance at the start of a Content Creators career.
Sources of revenue for higher earners (>$5,000+ a month)
We looked at a deep-dive of revenue sources for Content Creators earning more than $5,000 a month to validate the hypothesis that the higher the revenue, the more the passive income and the lesser focus on active revenue streams.
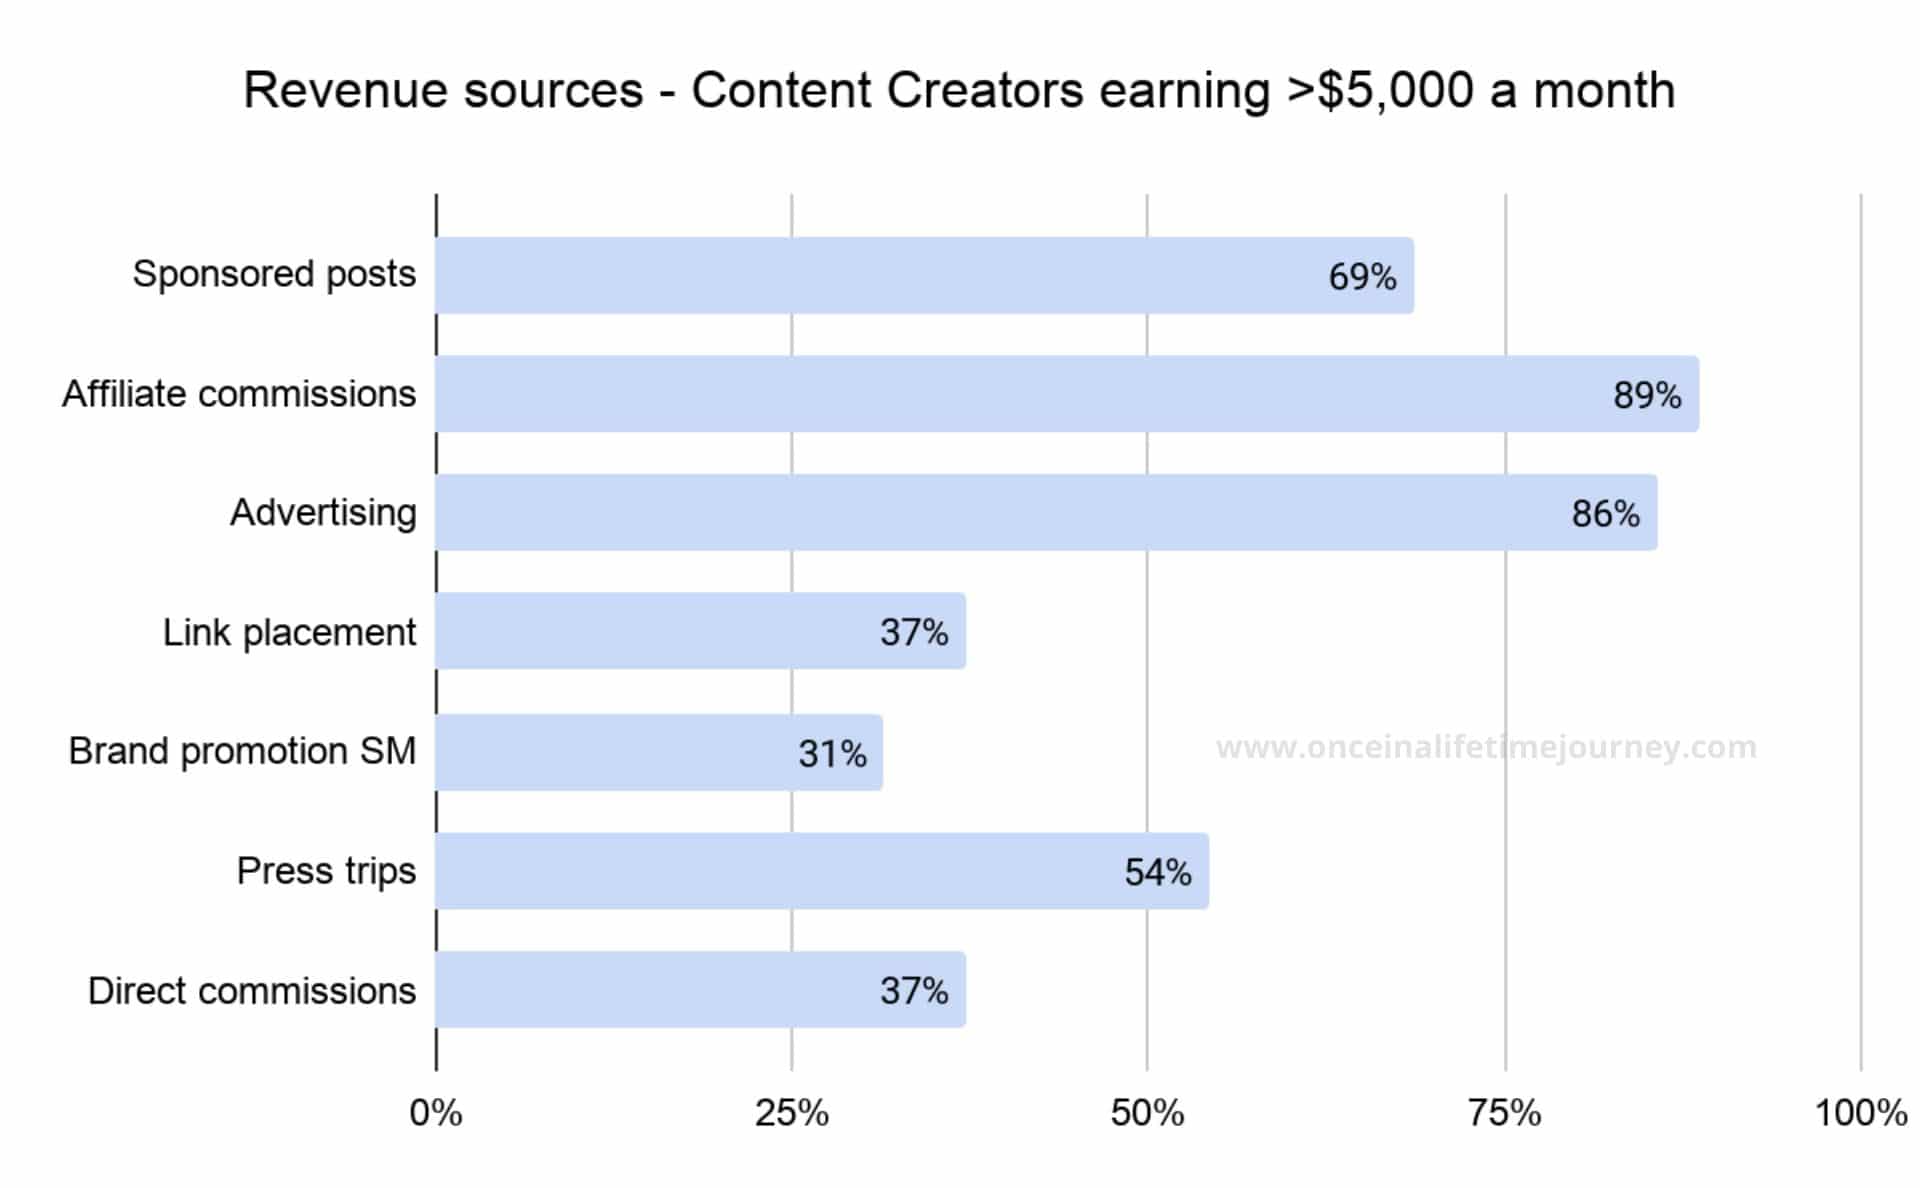
As their online presence, revenue and traffic grows, rates for active revenue streams go up, and Content Creators become much more selective in the opportunities they take.
With this shift, the importance of active revenue streams declines, as a % of the total (because of pure mathematics) and as an area of focus.
Here is the comparison with the overall sample. Higher earners do more of:
- Sponsored posts: 69% of earners above $5,000 a month do sponsored posts vs. 73% in the total sample.
- Affiliate commissions: 89% earn revenues via affiliate commission vs.72% in the total sample.
- Advertising: 86% have advertising on their site vs. 64% in the total sample.
And higher earners also do less of:
- Social media promotion: 31% of high earners promote brands on social media vs. 35% in the total sample.
- Link placements: Only 37% of the high earners sell link placements vs. 41% in the total sample.
Revenue diversification
What is unsurprising to anyone in the industry but an important reminder to all is the diversification of revenues.
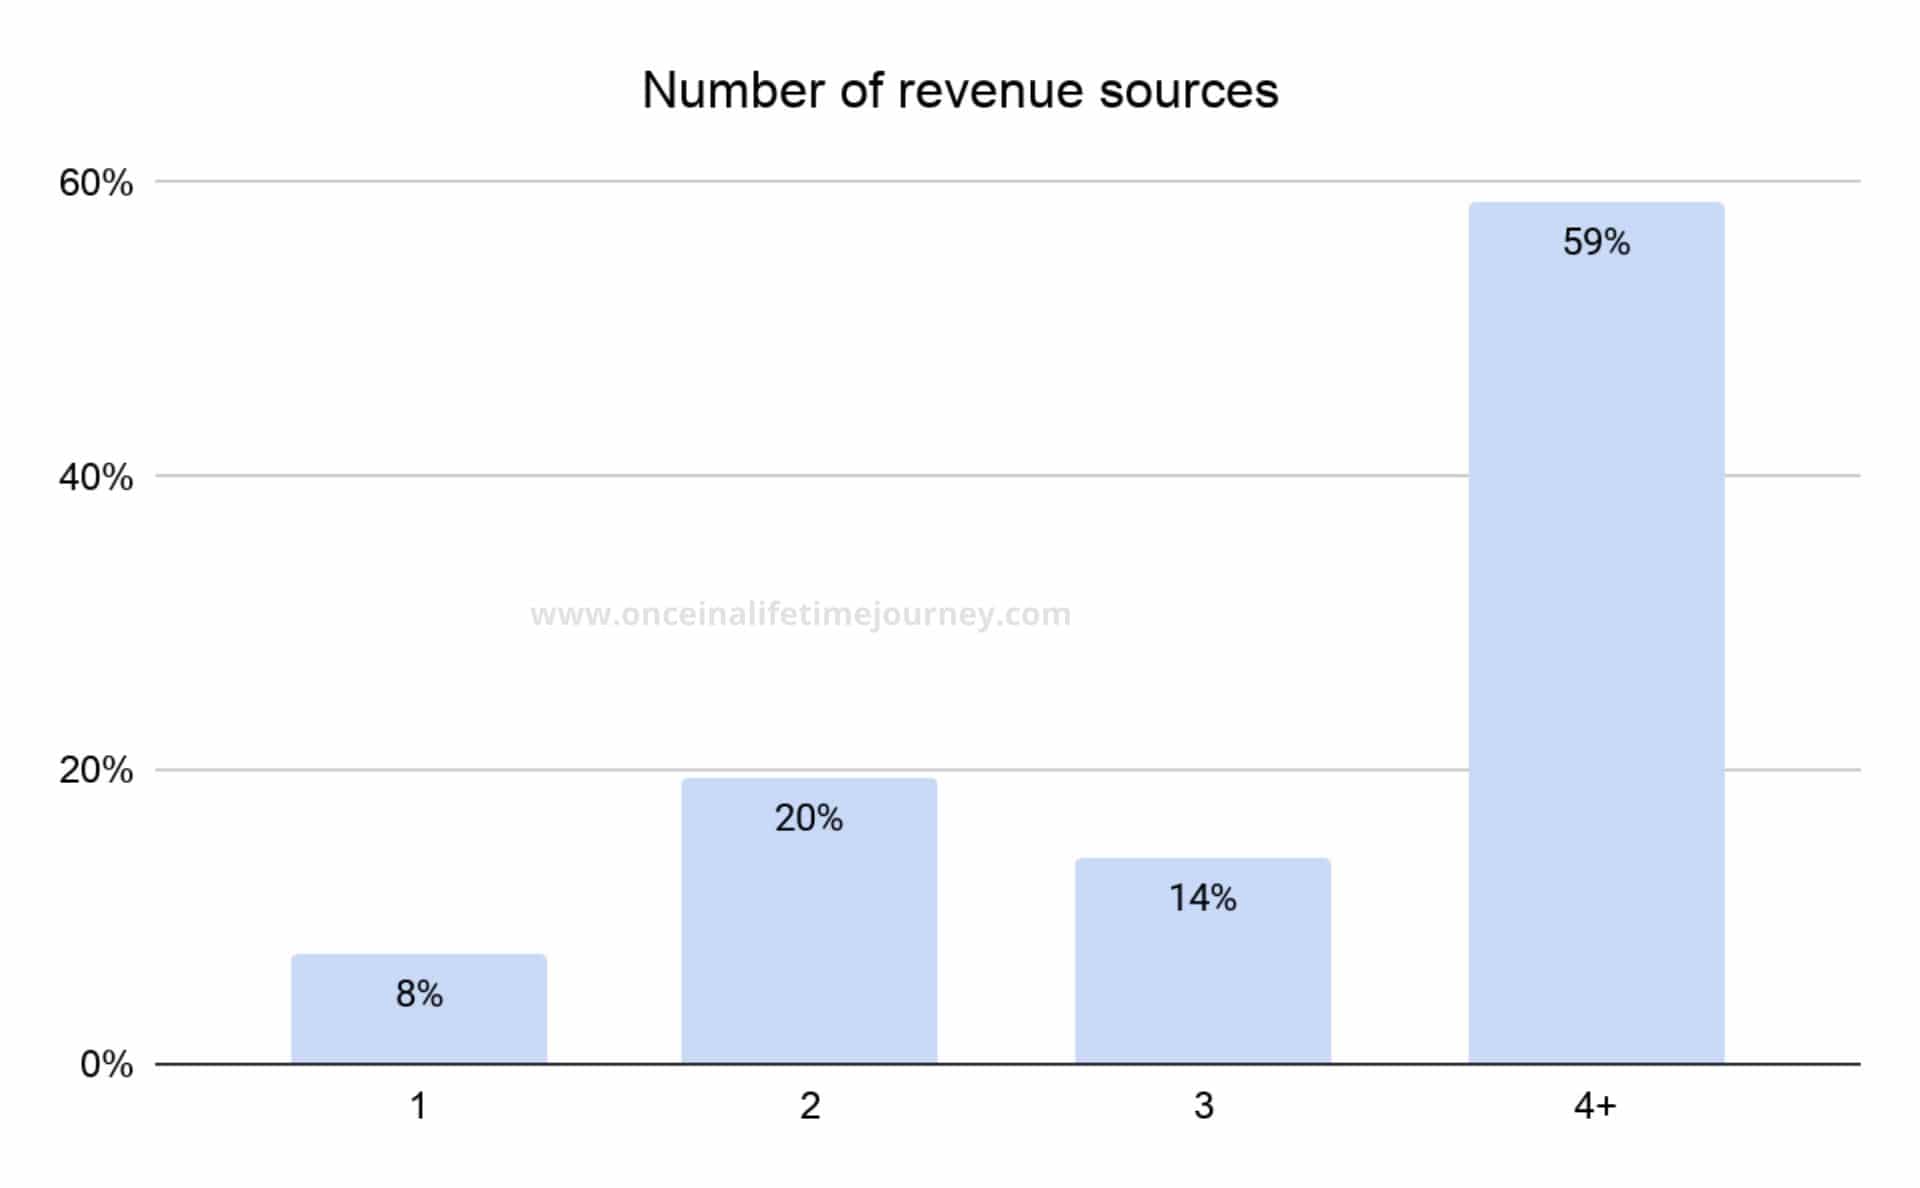
Only 8% of the respondents generated their income from a single revenue source, the majority leveraged several revenue streams and diversified. In fact, more than half of the respondents drew revenue from four or more sources.
Diversification is the most powerful tool against seasonality, unpredictability and lack of control over the third party channels (Facebook, Instagram, Google) and Content Creators know it best.
We complemented this question by asking what platforms generated a minimum of $100 monthly consistently in the last 6 months.
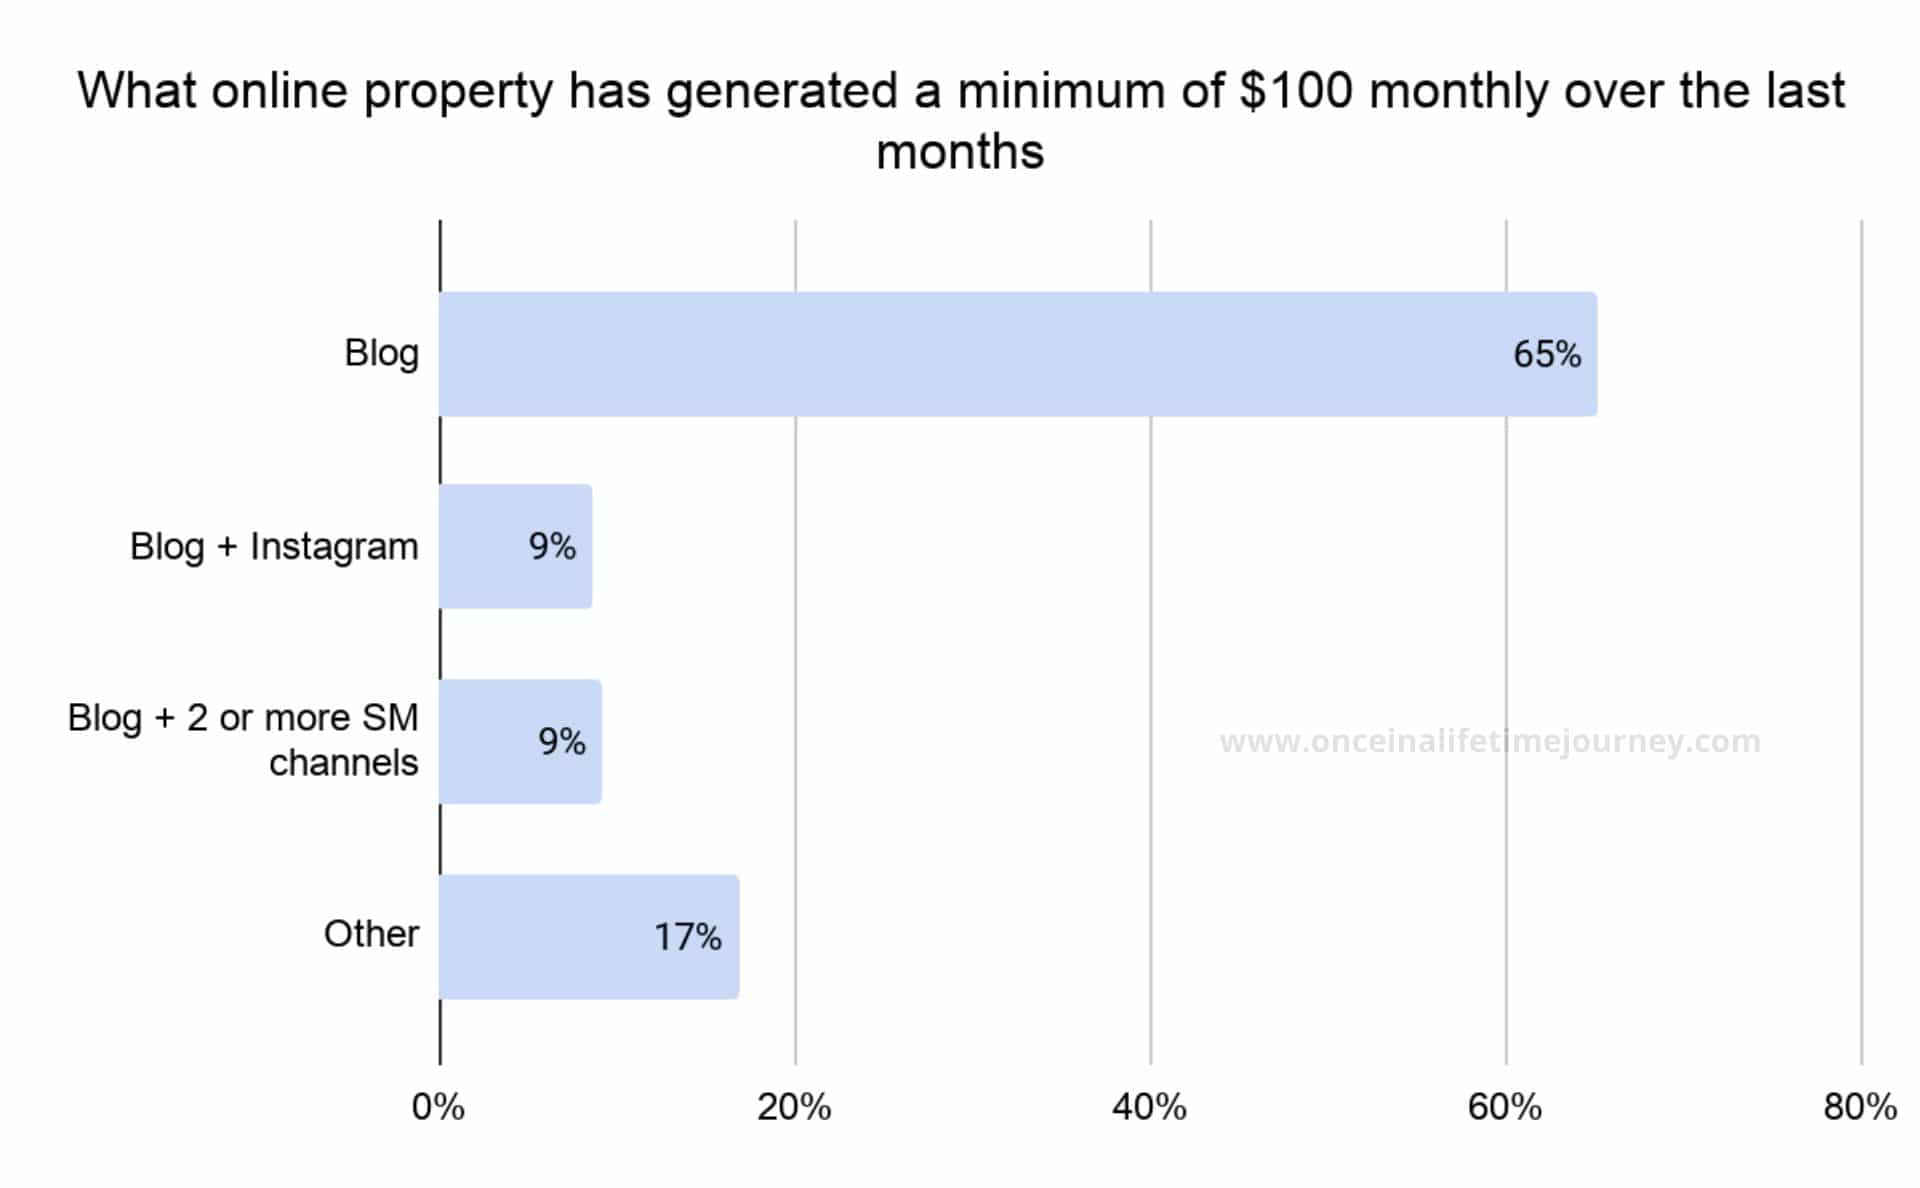
Blogs are the preferred monetisation channel for the respondents in our sample, followed by the combination of a blog plus an Instagram account.
Larger Content Creators with wide presence across several social media channels have also managed to monetise other channels beyond Instagram including Facebook, Twitter, YouTube and even Pinterest.
Brand Collaborations
Most outsiders to the content creation industry assume that brand collaborations and endorsements are Content Creator’s main revenue source.
This is in part because they do not equate a Content Creator with an Independent Publisher but with an Influencer, but also because the media always talks about the money made via social media campaigns (i.e. Instagram posts) rather than through ads, sponsored posts or affiliate commissions.
Case in point, despite the fact that I pay for 80% of the travel that I do, and I fully disclose when I am sponsored, paid or hosted, most of my audience (including people who know me personally) assume that my revenues come from brand collaborations.
The survey wanted to dig a bit deeper into this subject by asking a few questions with regards to brand collaborations.
5% of the Content Creators in our sample did not engage in any brand collaboration in the last 6 months, which means 95% did.
A brand collaboration can be anything from a sponsored post to a link placement to a social media campaign. So we wanted to know how these opportunities were found.
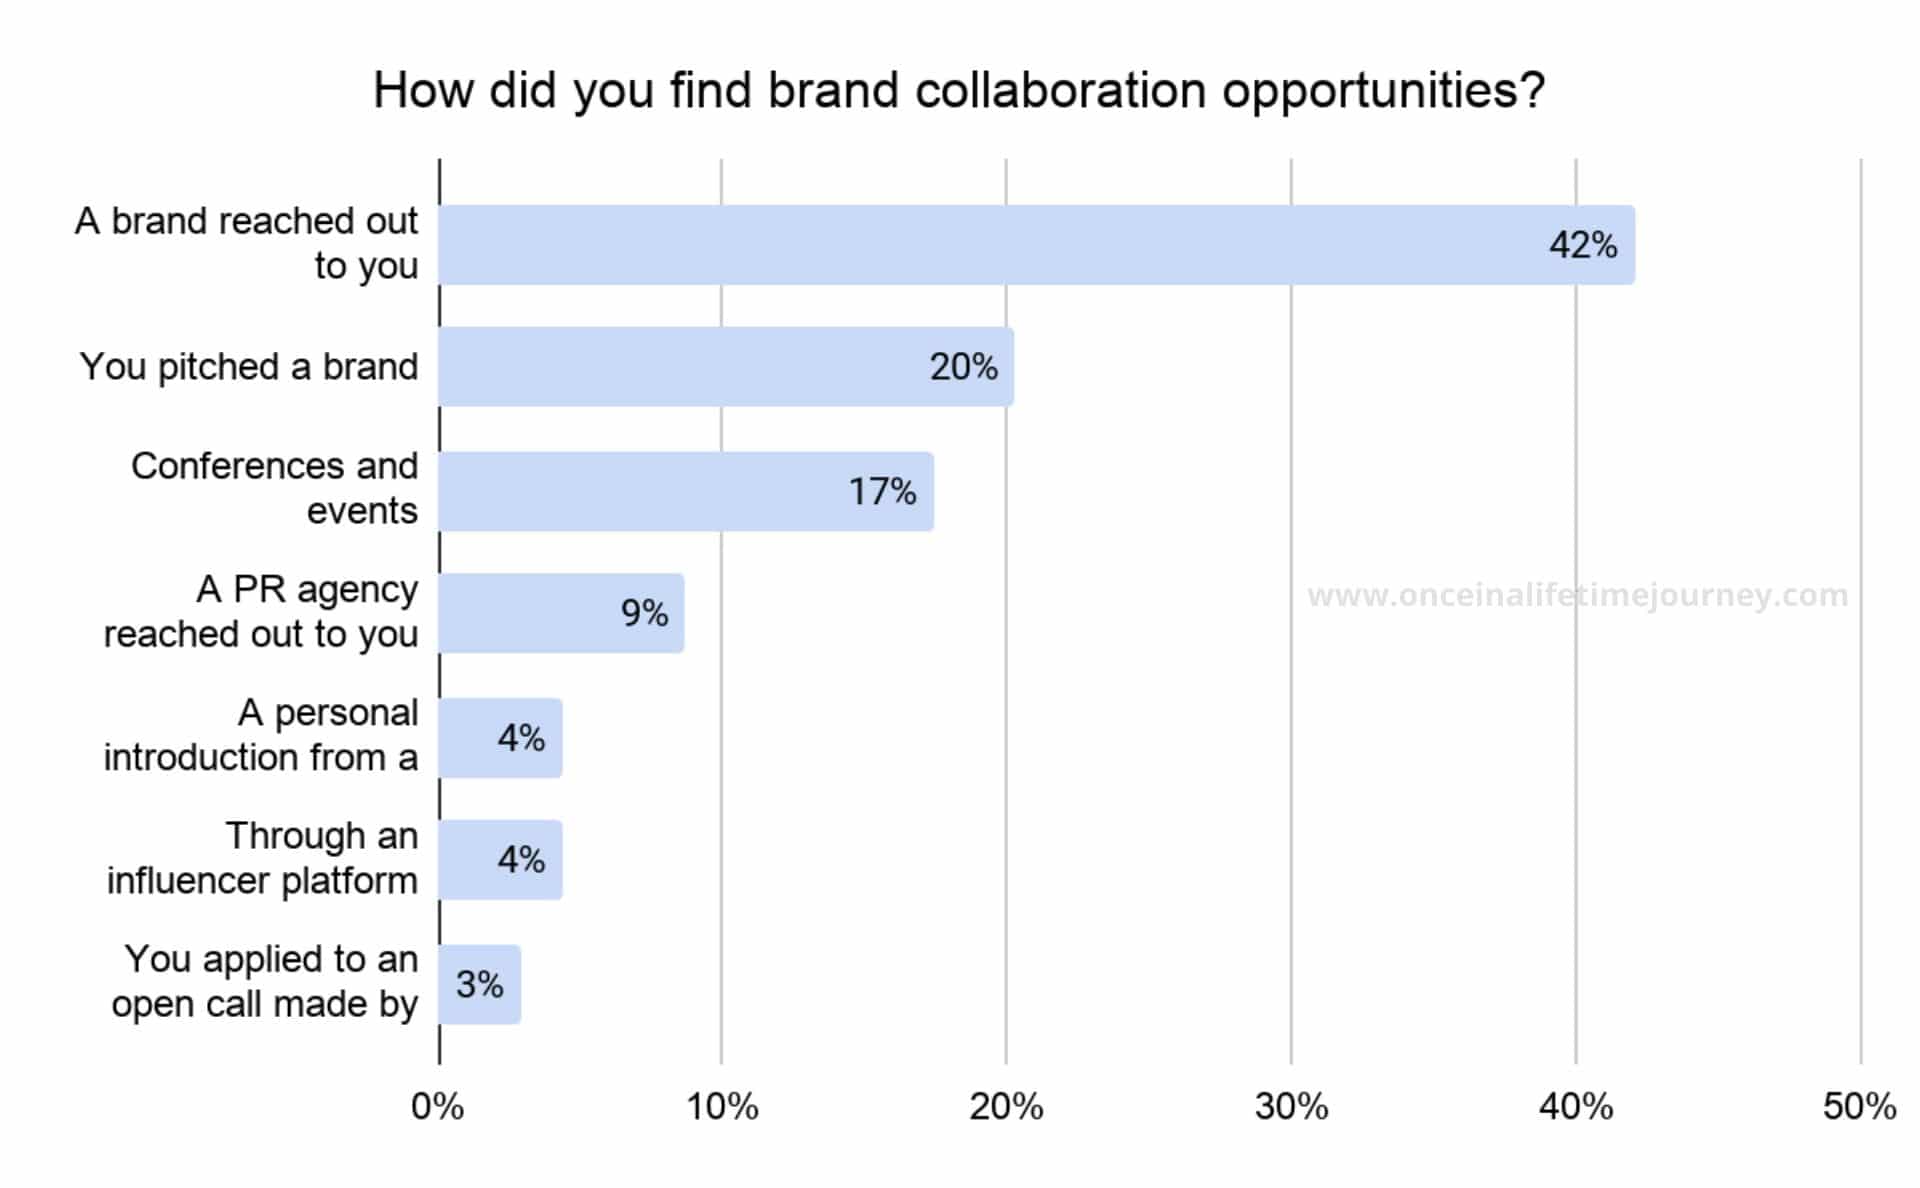
42% of these collaborations were initiated by the brands as opposed to 20% where a Content Creator pitched to a brand, and 17% that came via conferences and events.
While there are lots of online Influencer/Content Creator marketplaces, these combined are still a small source of opportunities for most. In many cases, Content Creators are unaware of their existence, in others, they are reserved to US-based, relatively large blogs and social media accounts.
Some of these marketplaces are (with my referral link if available):
- IZEA – One of the first and largest, also publicly traded, I get most of my blog campaigns through IZEA and TapInfluence.
- TapInfluence – One of the largest, merged with IZEA in 2017 and will be sunset in 2020.
- Activate – Tends to focus too much on barter and too little on paid campaigns for my liking.
- Socialpubli – With a stronger Spanish-speaking focus.
- Sway – Not to be confused with Swayy which focuses exclusively on hotel campaigns in barter format (it enjoyed a lot of buzz when launching but seems to be dying out and not much has been added in the last year).
- Linqia – Similar to Cooperatize and working on performance-based influencer campaigns.
- Theright.fit – Goes a bit beyond Content Creators to include talent without a distribution platform and allows for celebrities and models to sign-up as talent for campaigns.
- Buzzole – Works slightly differently from other influencer networks by giving you credits when you complete a campaign which you can exchange for Amazon gift cards. To me, this has little to no value but it may work for others.
- Considerable Influence – Is best suited for those in the UK as a lot of their campaigns are localized. There is a range of offers available, from appearances and events to video creation.
- Cooperatize – Evolved from a writing platform for freelance writers to a sponsored post platform based on performance-marketing metrics. Most of the opportunities pay a fee depending on the number of readers a post has, thus bridging the gap we talked about earlier between free independent publishers and subscription-based print publications.
- Seedingup – Has to be, in my opinion, the ugliest, clunkiest and most 1990s looking of all the platforms here and they often send offers for ridiculous prices ($5 per tweet?) but they have been around for a while and some people report making relevant money with them.
- Commission Junction – Better known as the largest affiliate network company, CJ also sends campaigns through to its affiliates via the brands on the platform and I have on occasion managed to work on lucrative campaigns.
- Obvious.ly – Is more for Influencers and online Content Creators than bloggers as their opportunities are usually social media-based. Payment is not common and barter exchanges are the norm.
- Clever – Is a very female and US-focused online platform that offers a range of lifestyle collaborations oftentimes with payment. I have found that there are very few travel-related opportunities and that household and lifestyle brands are more common.
- Tribe – Focuses on Instagram campaigns and has an easy to use interface. Note that you often need to submit the pitch with the actual (or a similar) photo to get the campaigns so it is only worth it if you can focus on this. Works only as an app.
- Vamp – Is similar to Tribe but very Australian focused. I found their demands and requirements very taxing and not worth it for the rates (you need to submit a pitch, sometimes need to go pick up a product, etc.). Works only as an app.
- Takumi – Is similar to Tribe and Vamp and focuses on Instagram only with a specific interest in content creation beyond the promotion of it.
- Cohley – Jumps on the wagon of Content Creators that may or may not have a blog and also allows professional photographers and videographers to monetise their talent.
- Famebit – Is owned by YouTube (Google) which focuses mostly on YouTube content.
Payment in kind
54% of the Content Creators surveyed worked with brands on a barter basis at least once in the last 6 months. The remaining 44% did not, either because they were not interested or because the opportunity was not available.
In these collaborations, no cash payment was offered but the Content Creator provided his or her marketing or content creation services in exchange for a product or service.
Under what circumstance does a Content Creator accept work in exchange for payment in kind?
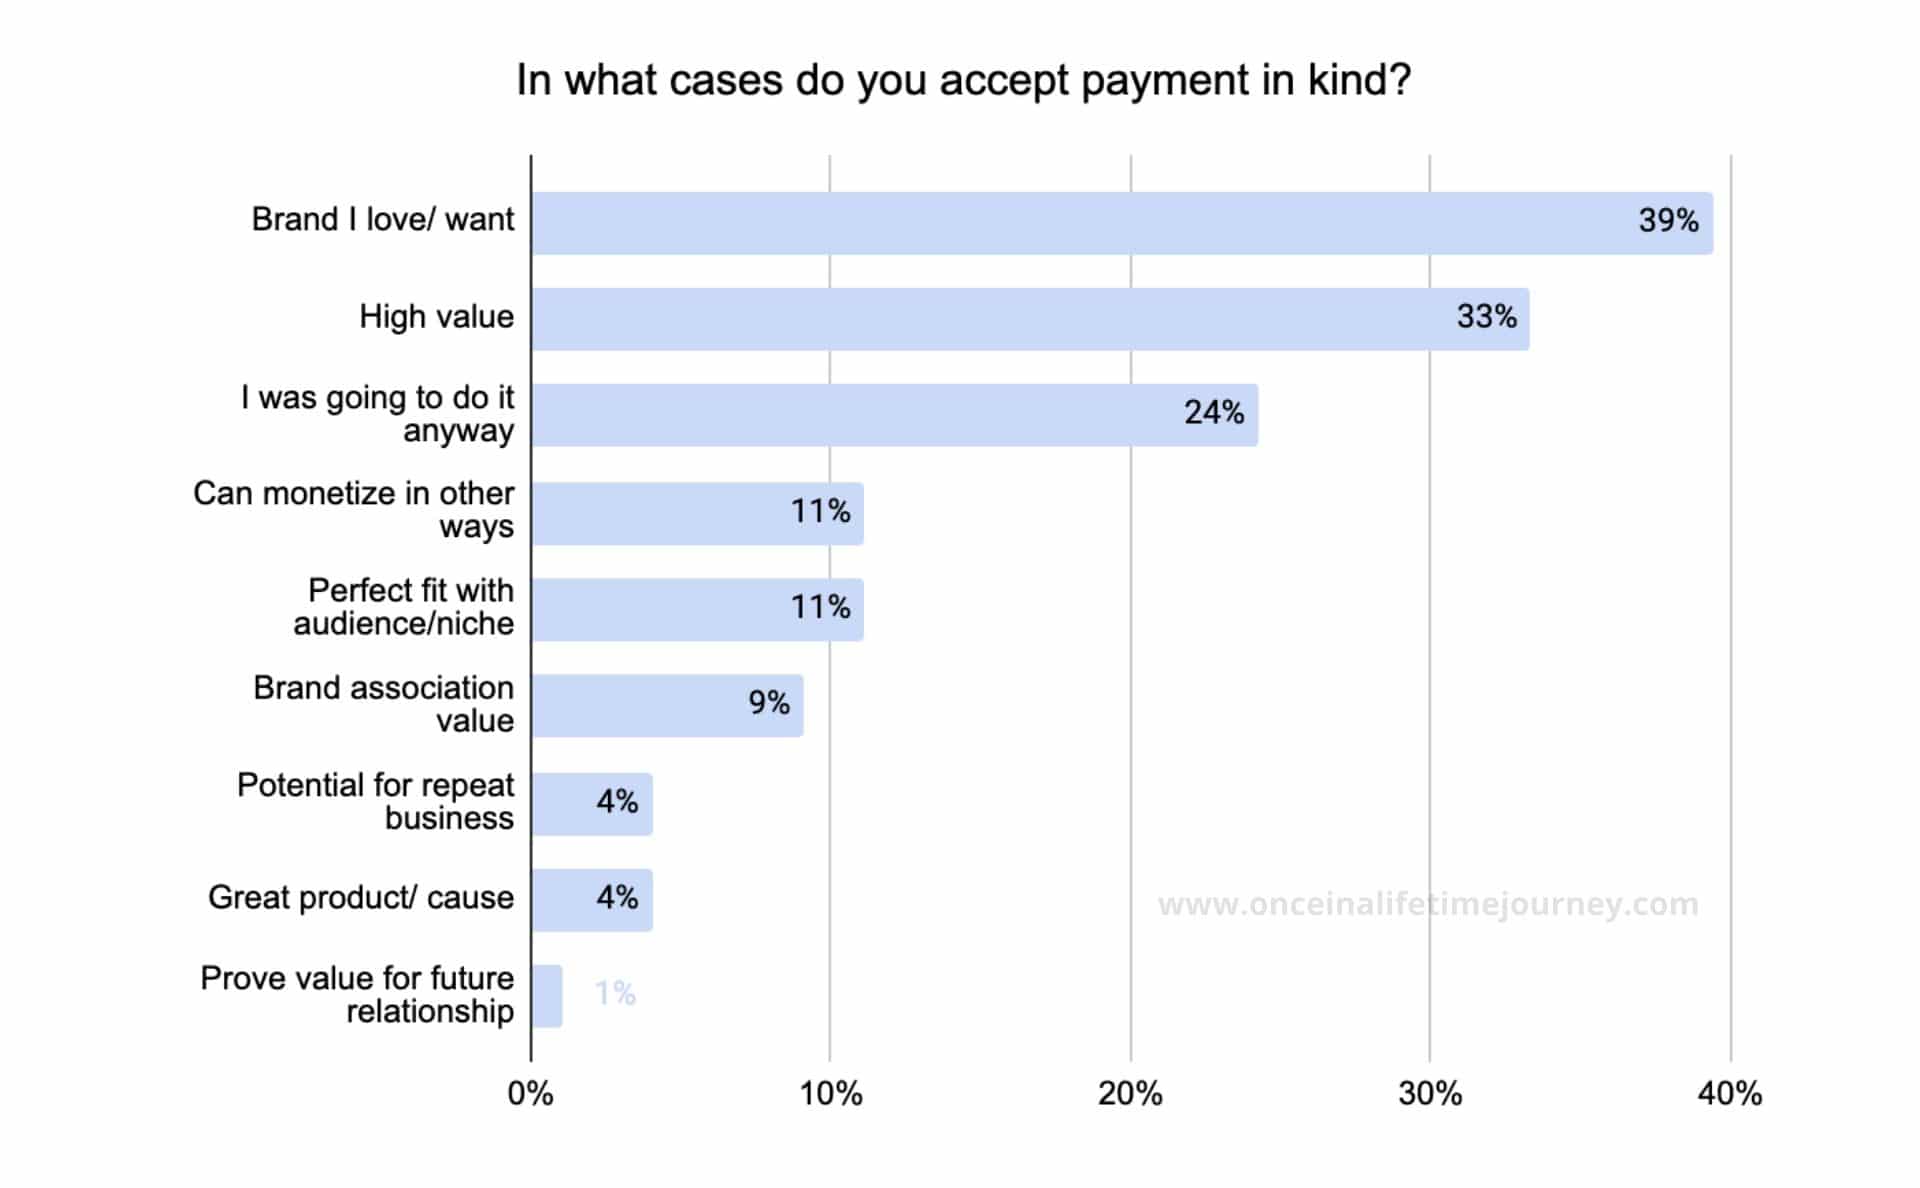
Most Content Creators are small businesses where the owner is also the employee and the decision maker. This means that the value of a payment in kind is directly enjoyed by the decision-maker, so any collaboration that involves a product or service being tested has an intrinsic value beyond the cash payment.
In most cases, acceptance of a barter collaboration happened when the brand was one the Content Creator loved or used already, or if the service or product given was of high value, equal, higher or close to the value of the services provided.
11% of the respondents indicated that they would accept payment in kind if they could monetize the content created in other ways, usually via affiliate commissions, or if they could attract an audience they were keen to engage.
Rate cards and fees
Where cash was exchanged, the survey asked respondents to provide their rate card for sponsored posts and social media posts.
Fees for sponsored posts
As we have seen, the most common service Content Creators provide are sponsored posts and link placements.
Advertorial posts are paid by a brand to reach the Content Creator’s audience. They should be fully disclosed and typically feature a product, service or destination and entice the readers to consider it in their next purchase decision.
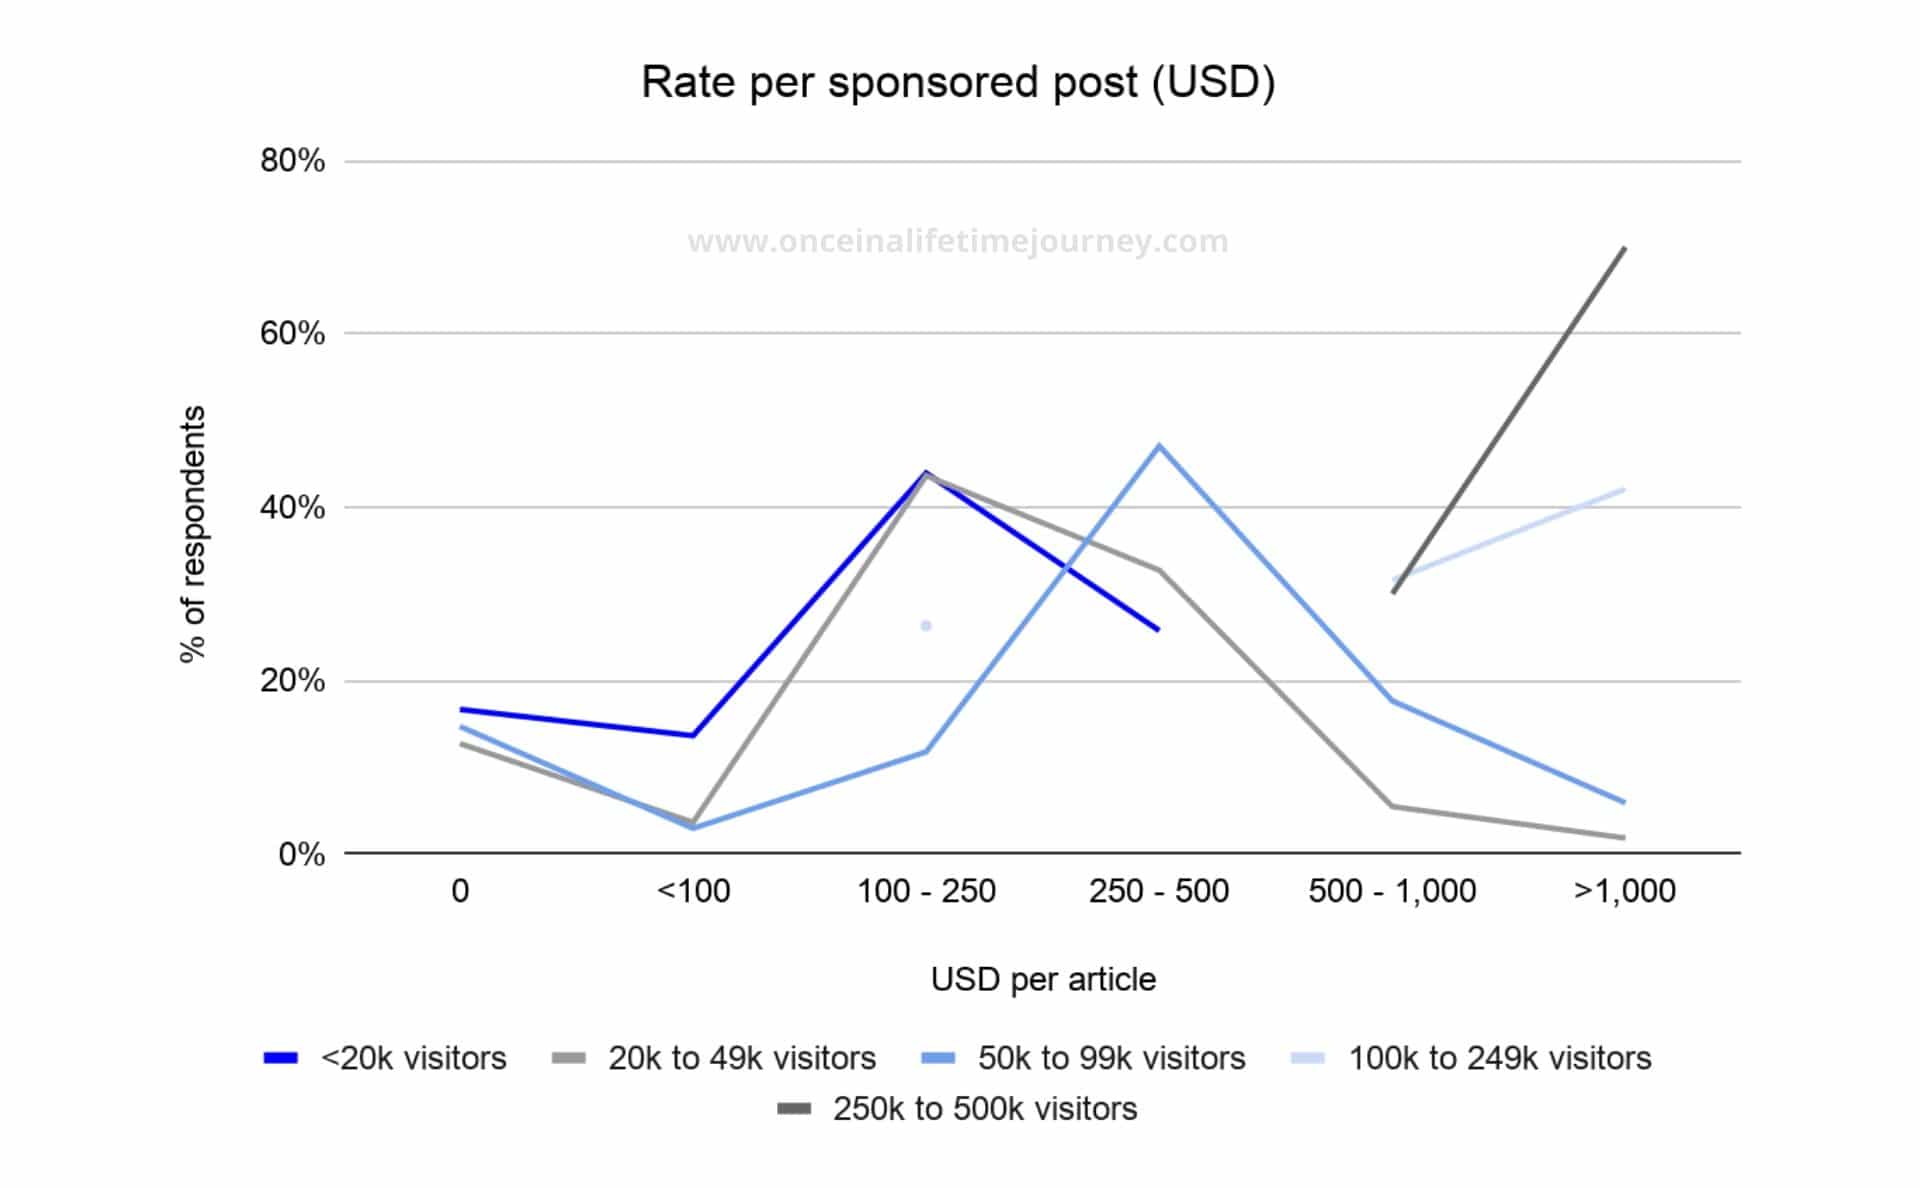
To understand the graph above, one must read every line as the distribution of rates per traffic level. For example, blogs with Less than 20,000 visitors a month charge between $100 and $250 on average with a smaller percentage charging less than $100 and a slightly higher percentage charging between $250 and $500.
As this is a service that provides a value equal to the readership reach there is a direct correlation between the traffic of a blog and the rates it commands. Blogs with traffic higher than 100,000 monthly visitors charge a minimum of $500.
However, while this rate card structure makes sense for a print or online magazine with a loyal audience, it is an inherited model that does not necessarily apply to free online publications.
In the case of many blogs, readership is attracted through SEO and online searches rather than loyal monthly readers so purchasing an article does not guarantee readership in the same way.
Brands should understand this and look beyond top-line readership and more into topic affinity, authority and fit with the brand.
Fees for link placements
When we looked at the sources of revenue earlier in this section we saw that the second most common active source of revenues was link placements.
In this survey we did not ask respondents to provide their rates for link placements because we have a 1,000+ database of rates with nuanced values for a large sample of bloggers with wide geographic and niche spread that we could tap on to draw conclusions.
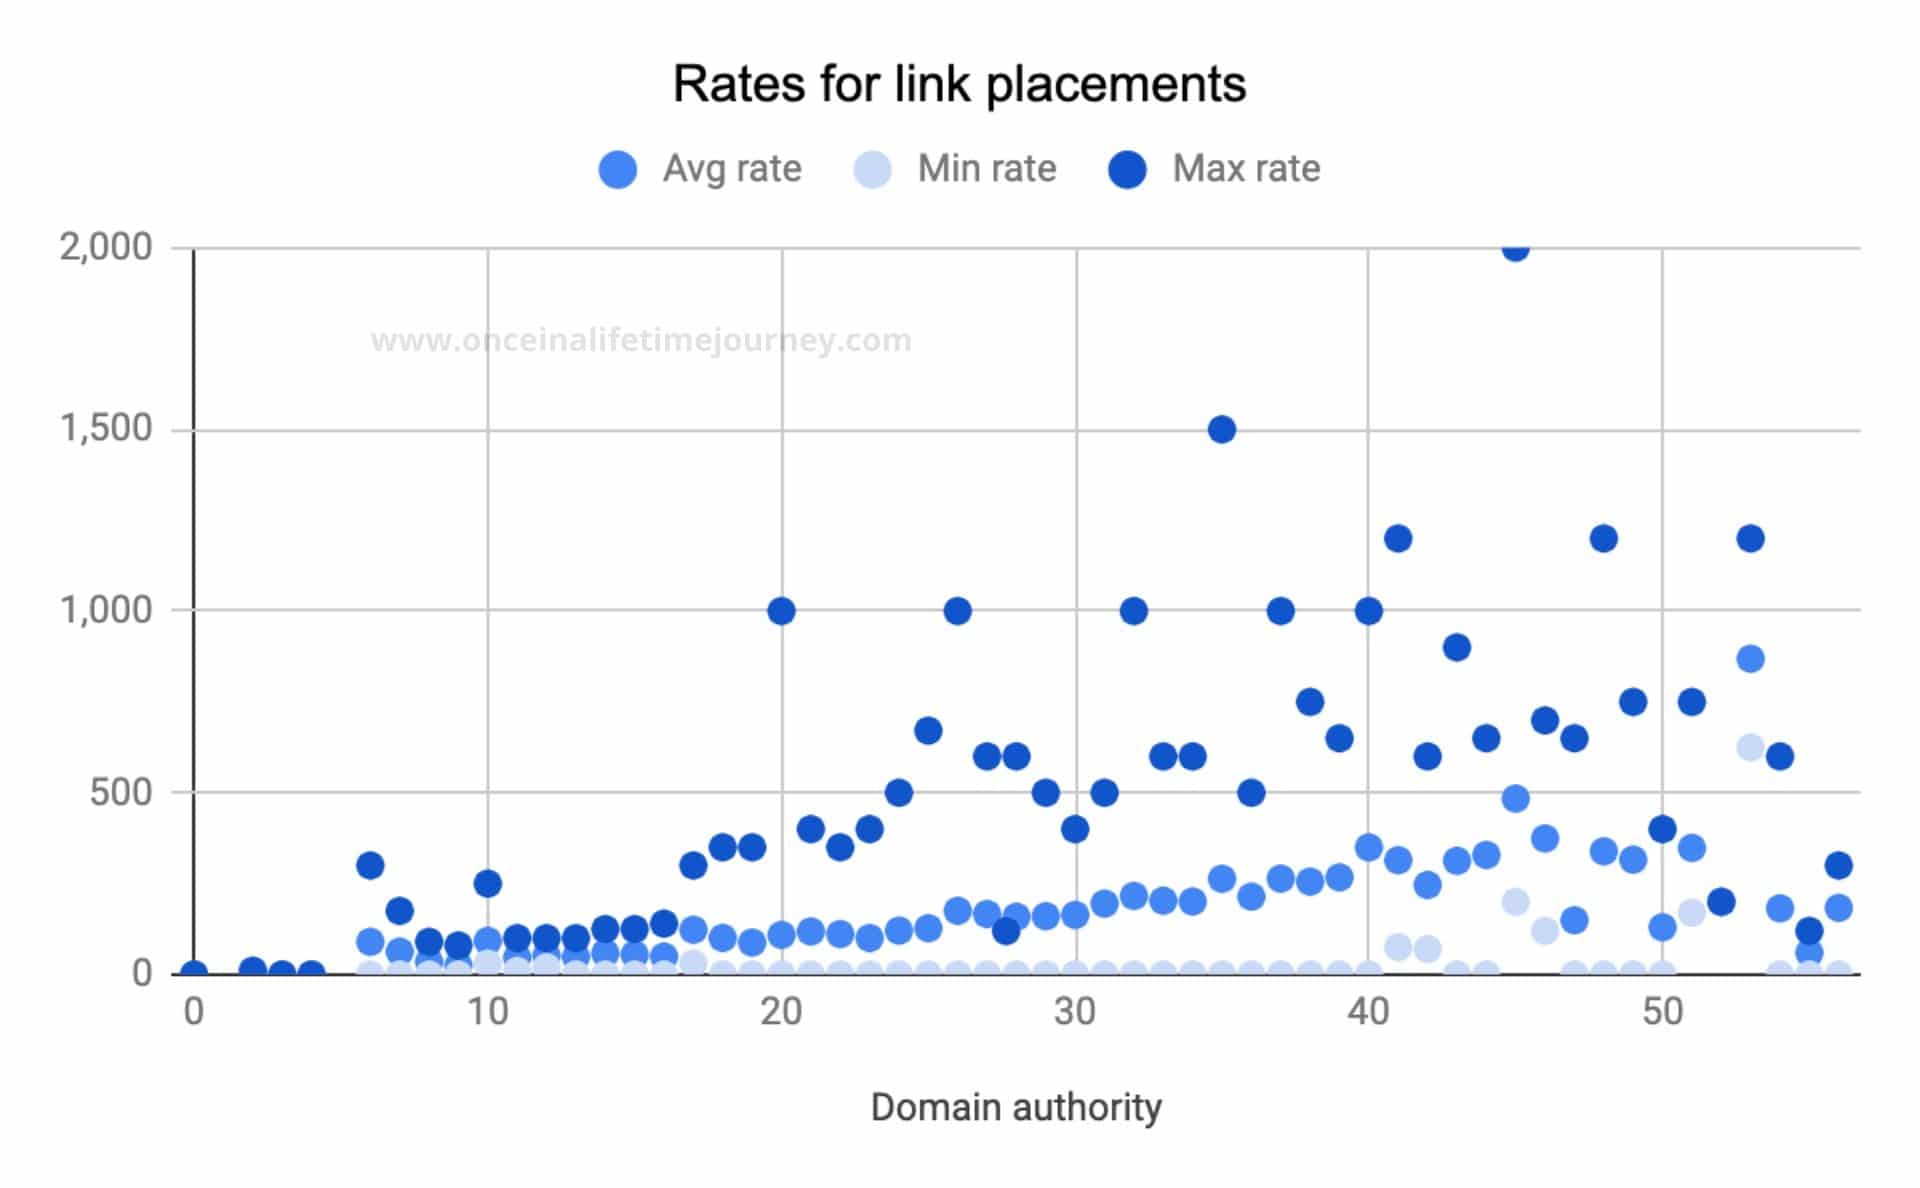
Note: The graph above has not been built with data from the 2019 Professional Content Creator Survey but with data from our proprietary database.
From the above graph we can see there is an implicit market rate for links based on the domain authority of a website, as we previously discussed. However, as DA increases, this range between minimum and maximum rates charged, increases.
The range between the cheapest and the most expensive blog to buy a link from widens as the DA increases. This is in part due to the fact that bloggers with higher DA are more experienced (DA strongly correlates with age of the site) and probably have a wider range of revenue sources and have thus become more selective (we have seen this trend before).
It is also due to the fact that, should a manual action be applied by Google to penalise the site, what is at stake is larger for what is essentially a smaller percentage of revenues in a more diversified and larger revenue pie.
When rate cards are not followed
We have been talking about rate cards for services provided, but we know that these are not always followed and that there is a degree of negotiation involved in every campaign.
Do Content Creators accept work below their rates? And If so, under what circumstances?
64% of the Content Creators have admitted accepting work below their rate card at least once in the last 6 months.
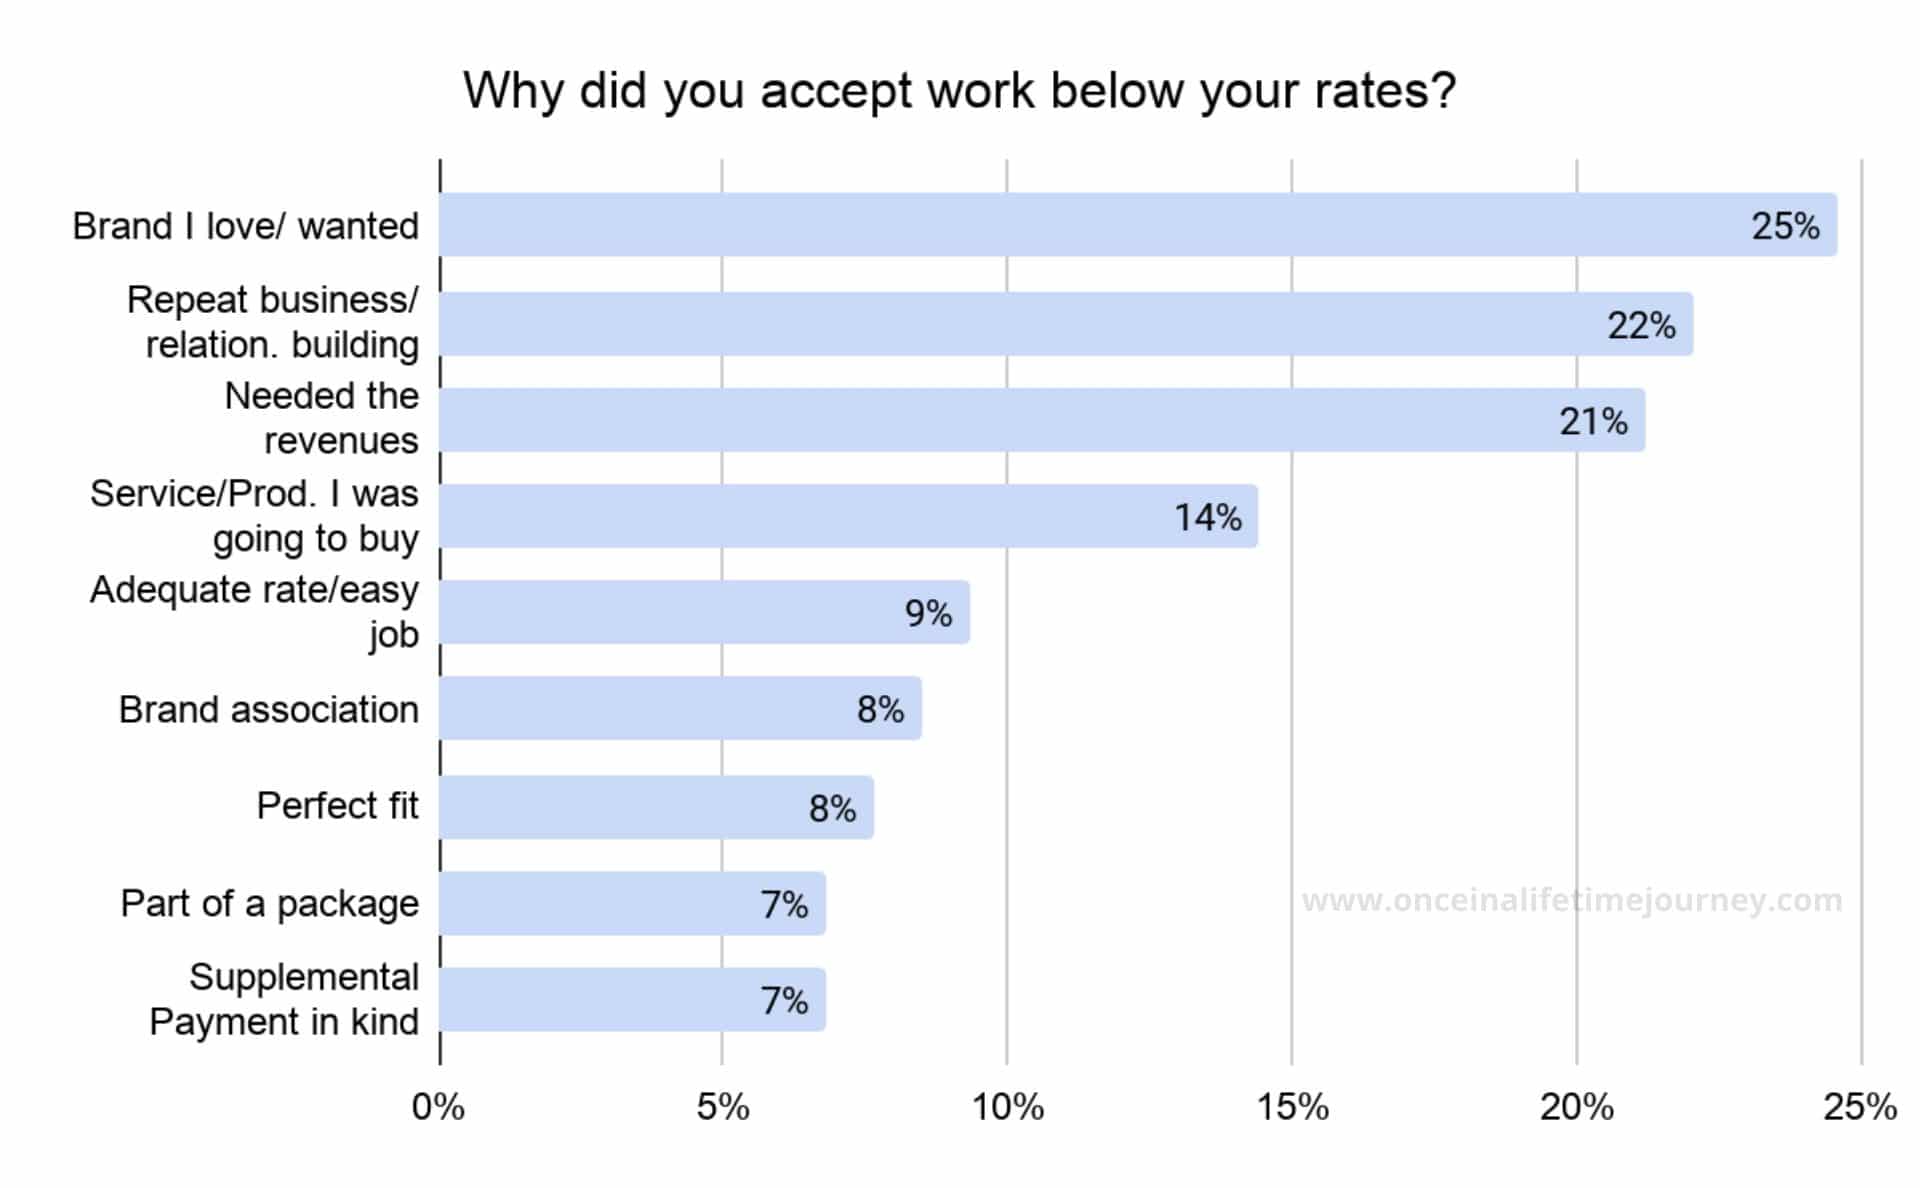
Usually, this is because it was a brand they really wanted to work with (25%), because of (the promise of) repeat business or the willingness to develop a relationship with the brand (22%) or because they needed the money (21%).
The content creation business is an unpredictable one where revenues fluctuate monthly. On slower months, respondents admitted to being more open to accepting rates below their rate card.
Affiliate commissions
Another main source of revenue for Content Creators are affiliate marketing commissions.
These are typically organized via ready affiliate programs either run by the brand itself or third-party affiliate networks such as Commission Junction. Content Creators make a commission with every sale they refer to the brand.
In the case of the travel niche, perhaps one of the most sophisticated when it comes to affiliate programs, hotel booking sites (like Booking.com or Agoda), car rental companies, and tour aggregators (such as GetYourGuide or Klook) all provide commissions on sales referred by the blog.
We wanted to understand how our sample did with affiliate marketing sales as they require a degree of knowledge that goes beyond the regular skillset of a Content Creator, so we asked specific questions to the 72% who responded they generated income via affiliate sales.
Firstly, let’s look at the challenges to monetization of affiliate commissions.
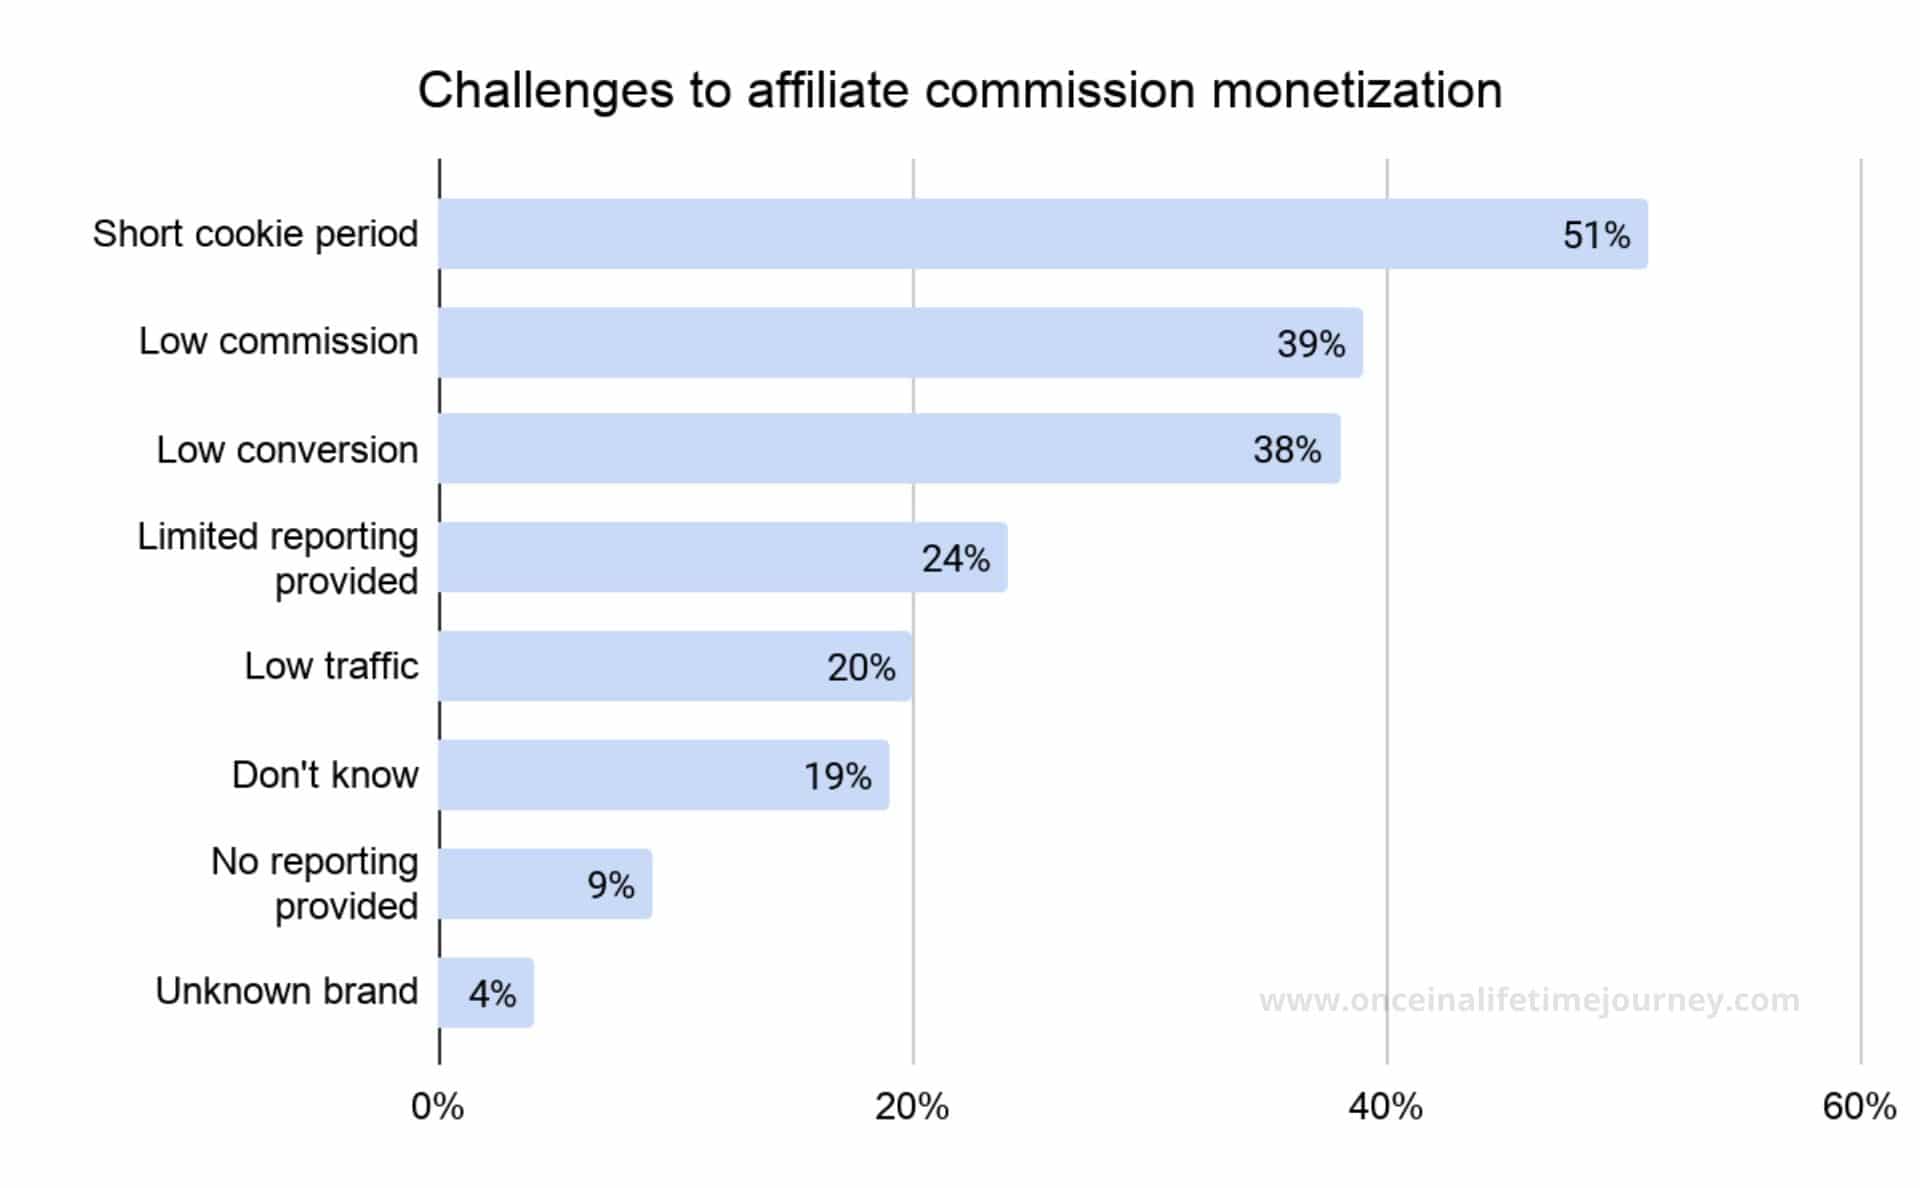
Short cookies, low commissions and low conversion rates are the top issues. Some of these challenges are endemic to the industry and its predominant players, while others are within reach of the Content Creators.
Short cookies and lack or limited reporting are difficult to overcome hurdles while low conversion rates or traffic are areas that can be tackled.
On a subsequent question, we asked respondents to express what their main pain points were. While the results are similar, they are also more specific than the statements we provided.
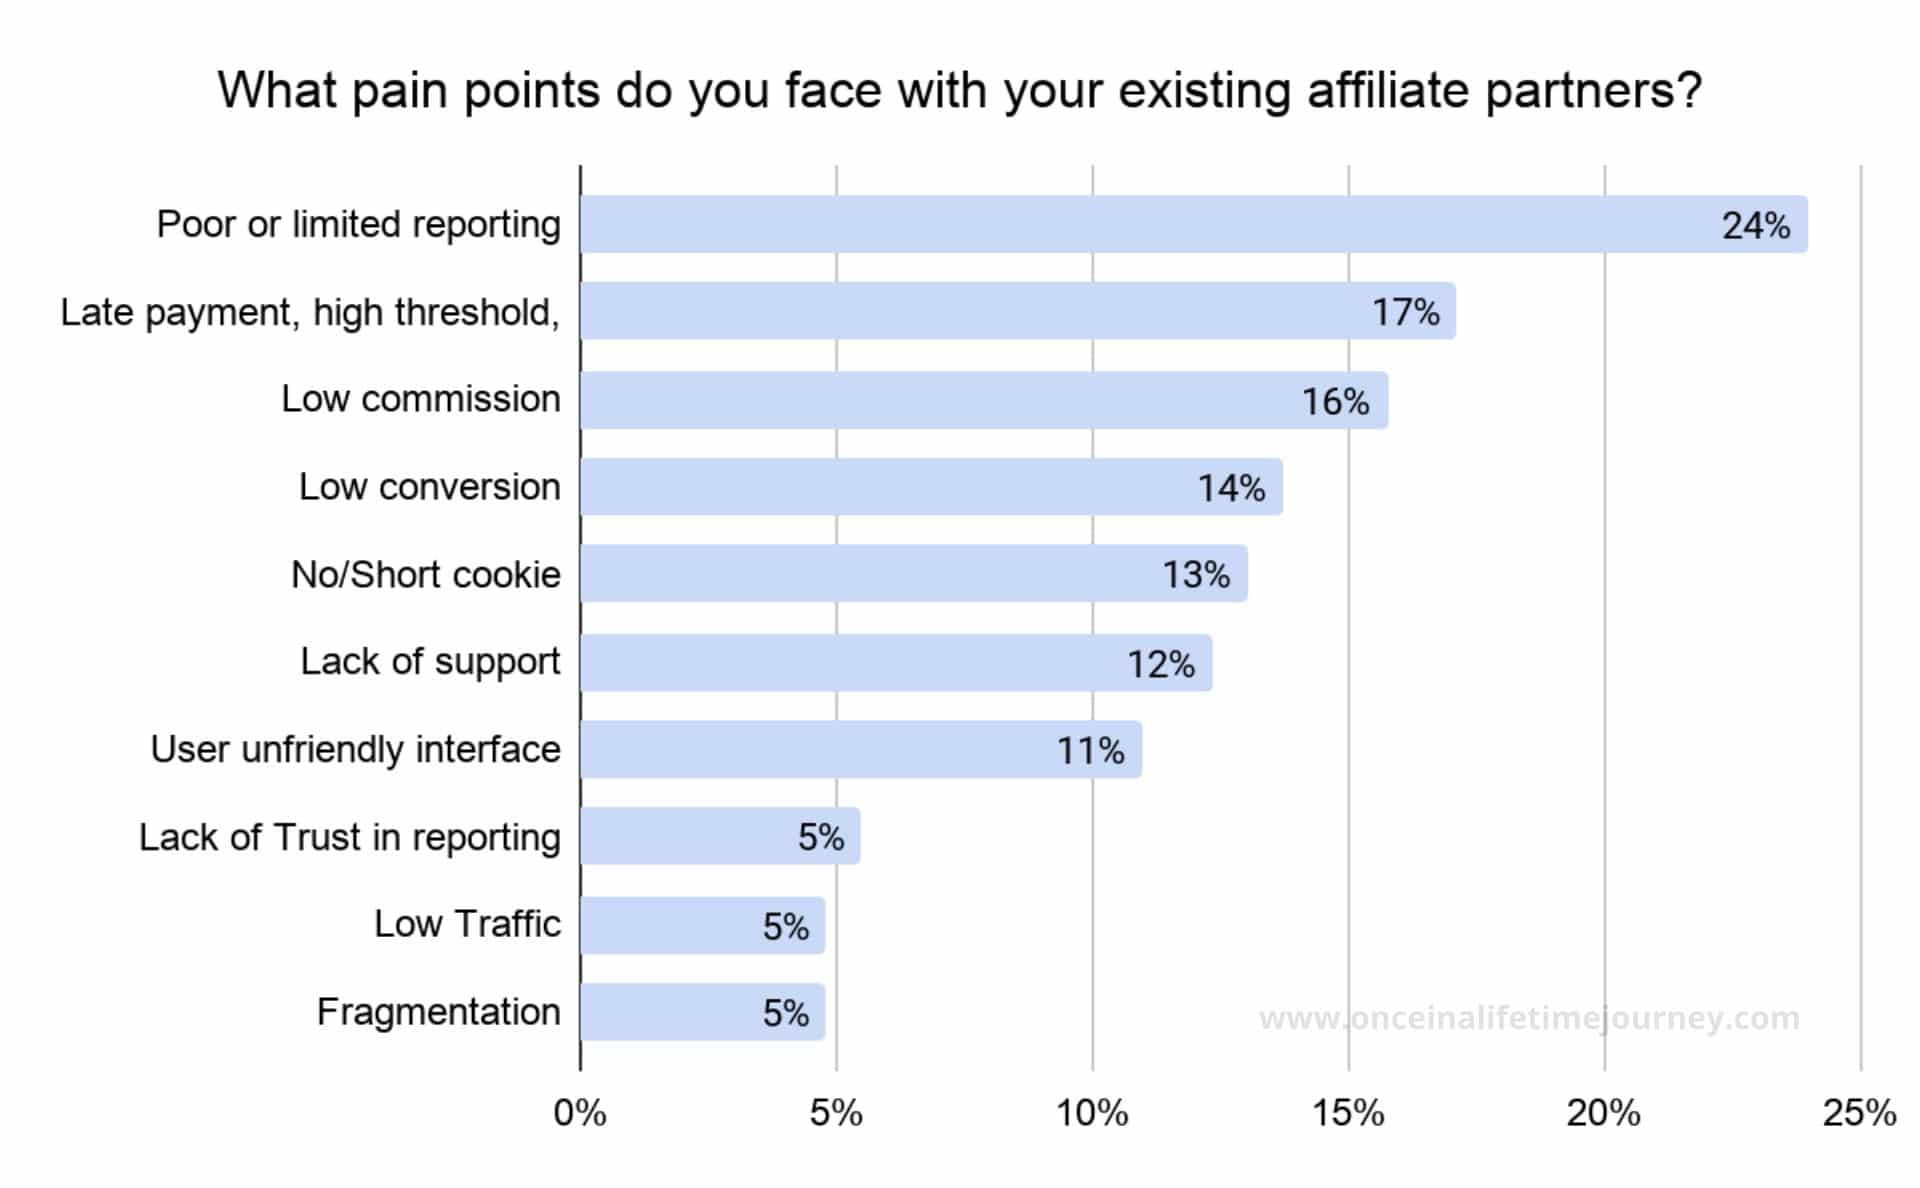
One of the biggest challenges faced by Content Creators with regards to affiliate programs is a poor, limited, difficult or incomplete reporting back-end. Without reporting, it is hard to maximise conversion rates or track progress.
Another common issue faced is related to payment and trust. 17% of the respondents reveal they experience payment-related issues, be it because payment comes in late, because the minimum threshold to withdraw the funds it too high or because the payment method is inconvenient (i.e. payment only available by cheque to those living outside the US).
Anecdotally, we know that this is a common issue that affects even the largest travel companies.
We also asked respondents to share, in an open-ended question, what they would like their affiliate partners to support them with in an effort to look for opportunities for improvement, and these are the requests.
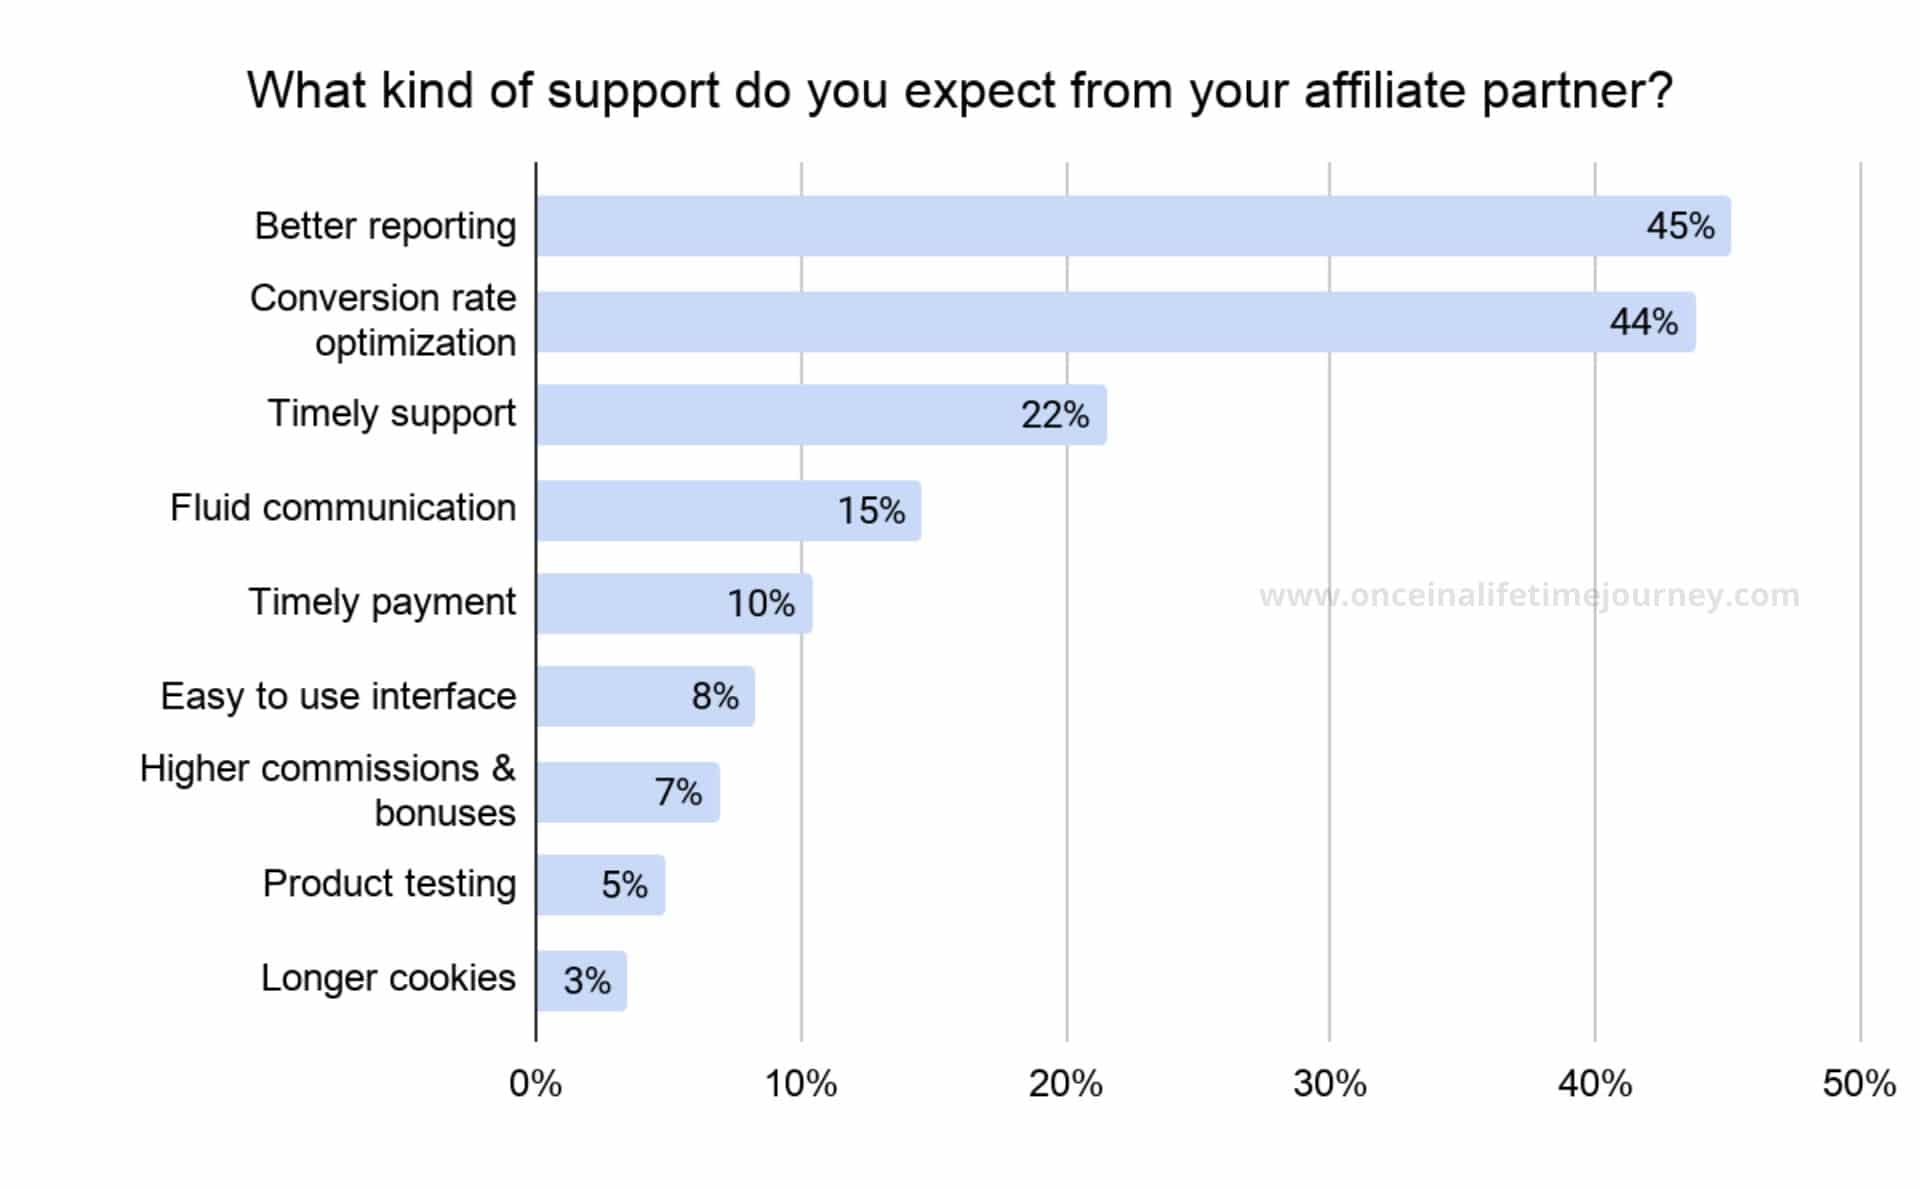
Around half of the Content Creators would like their affiliate partners to provide them with better reporting and with support to improve their conversion rates.
Conversion rate optimisation can be best tackled, at scale, via online content and training, so we also asked Content Creators to tell us what kind of content they would like to receive.
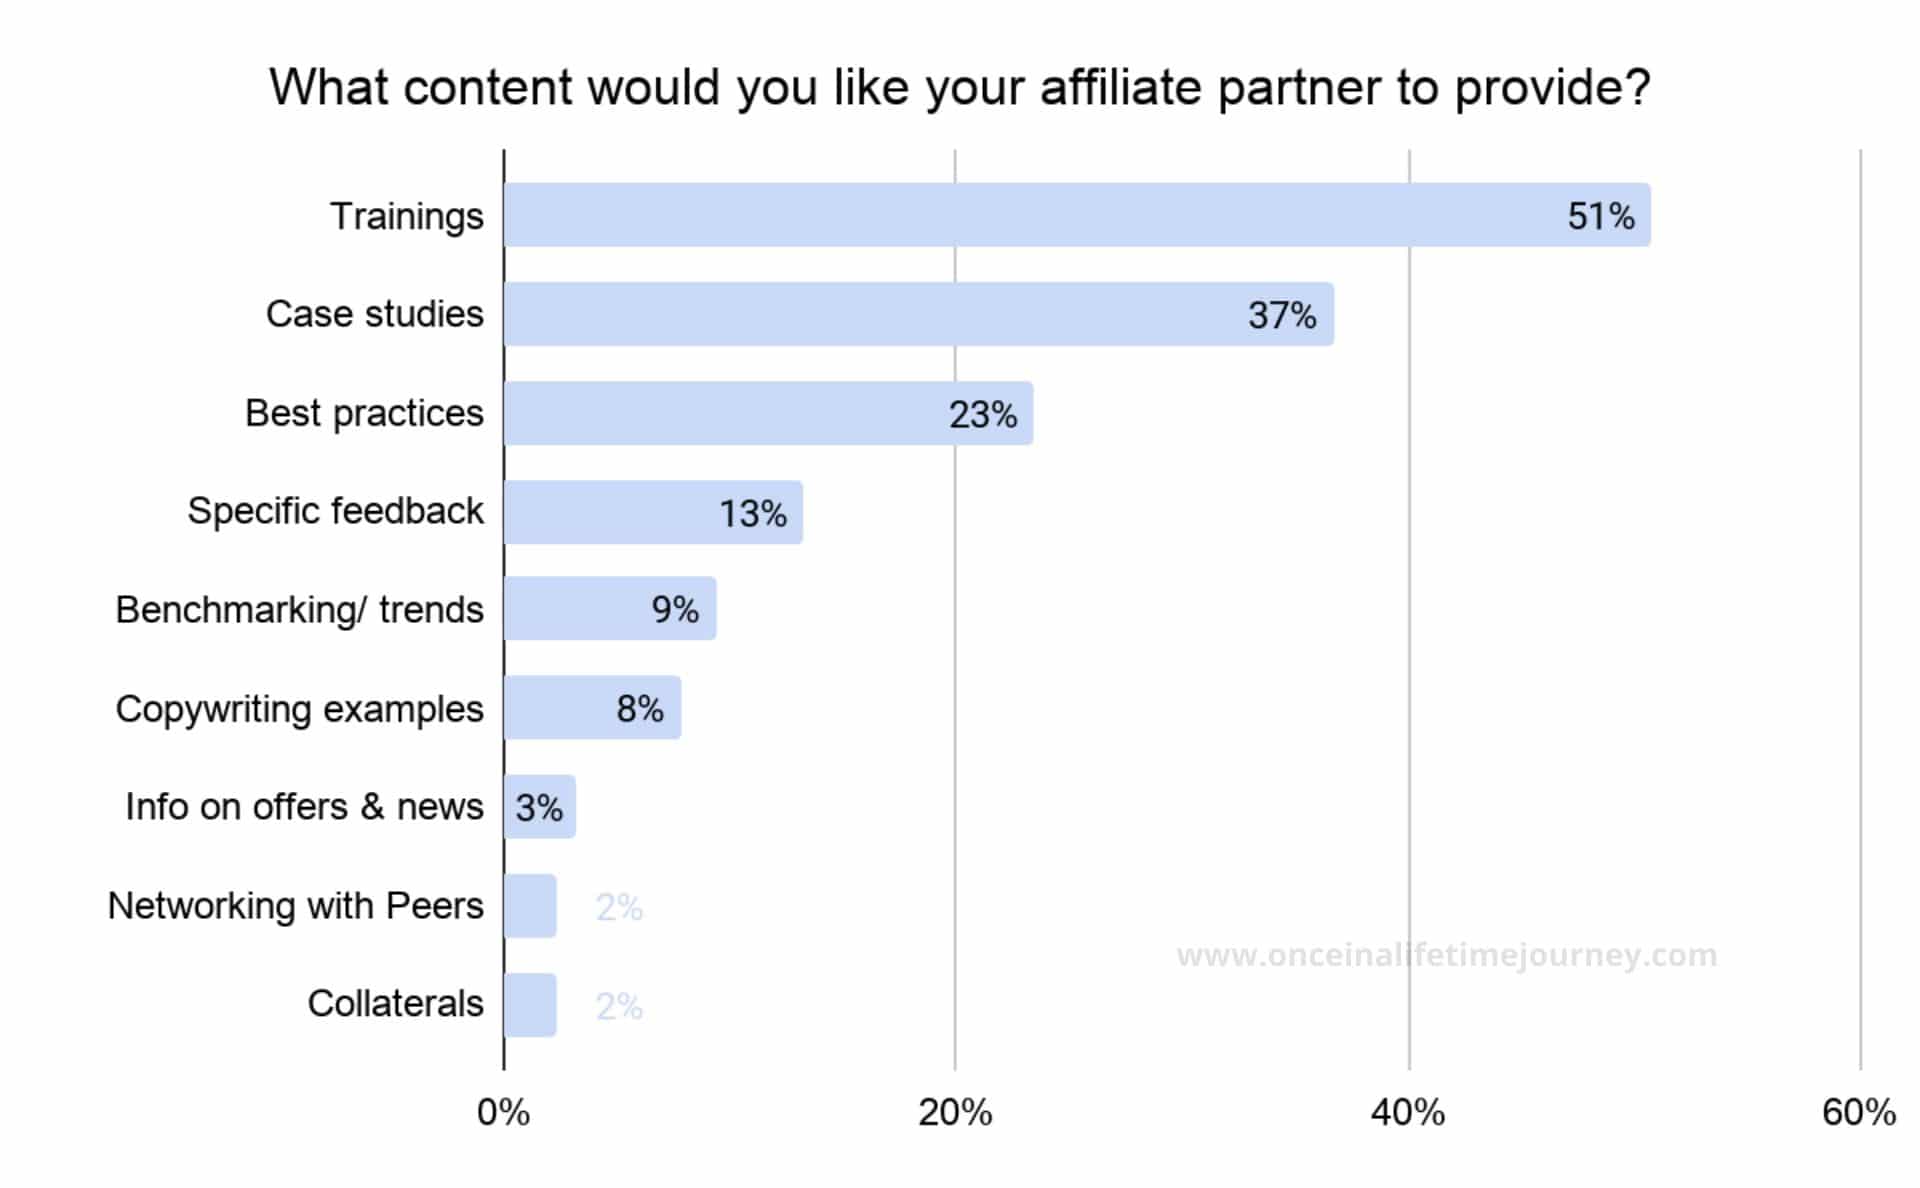
Most Content Creators are looking for partner support in the form of training, case studies and best practices. The focus is on self-learning.
Predictors of revenue
What is the best predictor of revenues? Do Content Creators need to work longer and harder to generate more income? Does traffic come first, then revenues?
Or are there economies of scale and passive income streams that can be leveraged to grow revenues without having to work longer hours?
Can the “Build it and they will come” mentality that has worked in so many industries, work in content creation? Or is an analytical, razor-sharp approach better?
Let’s look at these in more detail.
Traffic as predictor of revenue
The most obvious predictor of revenues is traffic.
Larger blogs bring in more eyeballs and are assumed to be able to generate higher incomes. While this is a valid generalization, the type, location and “quality” of the audience play a much larger role than an outsider would expect.
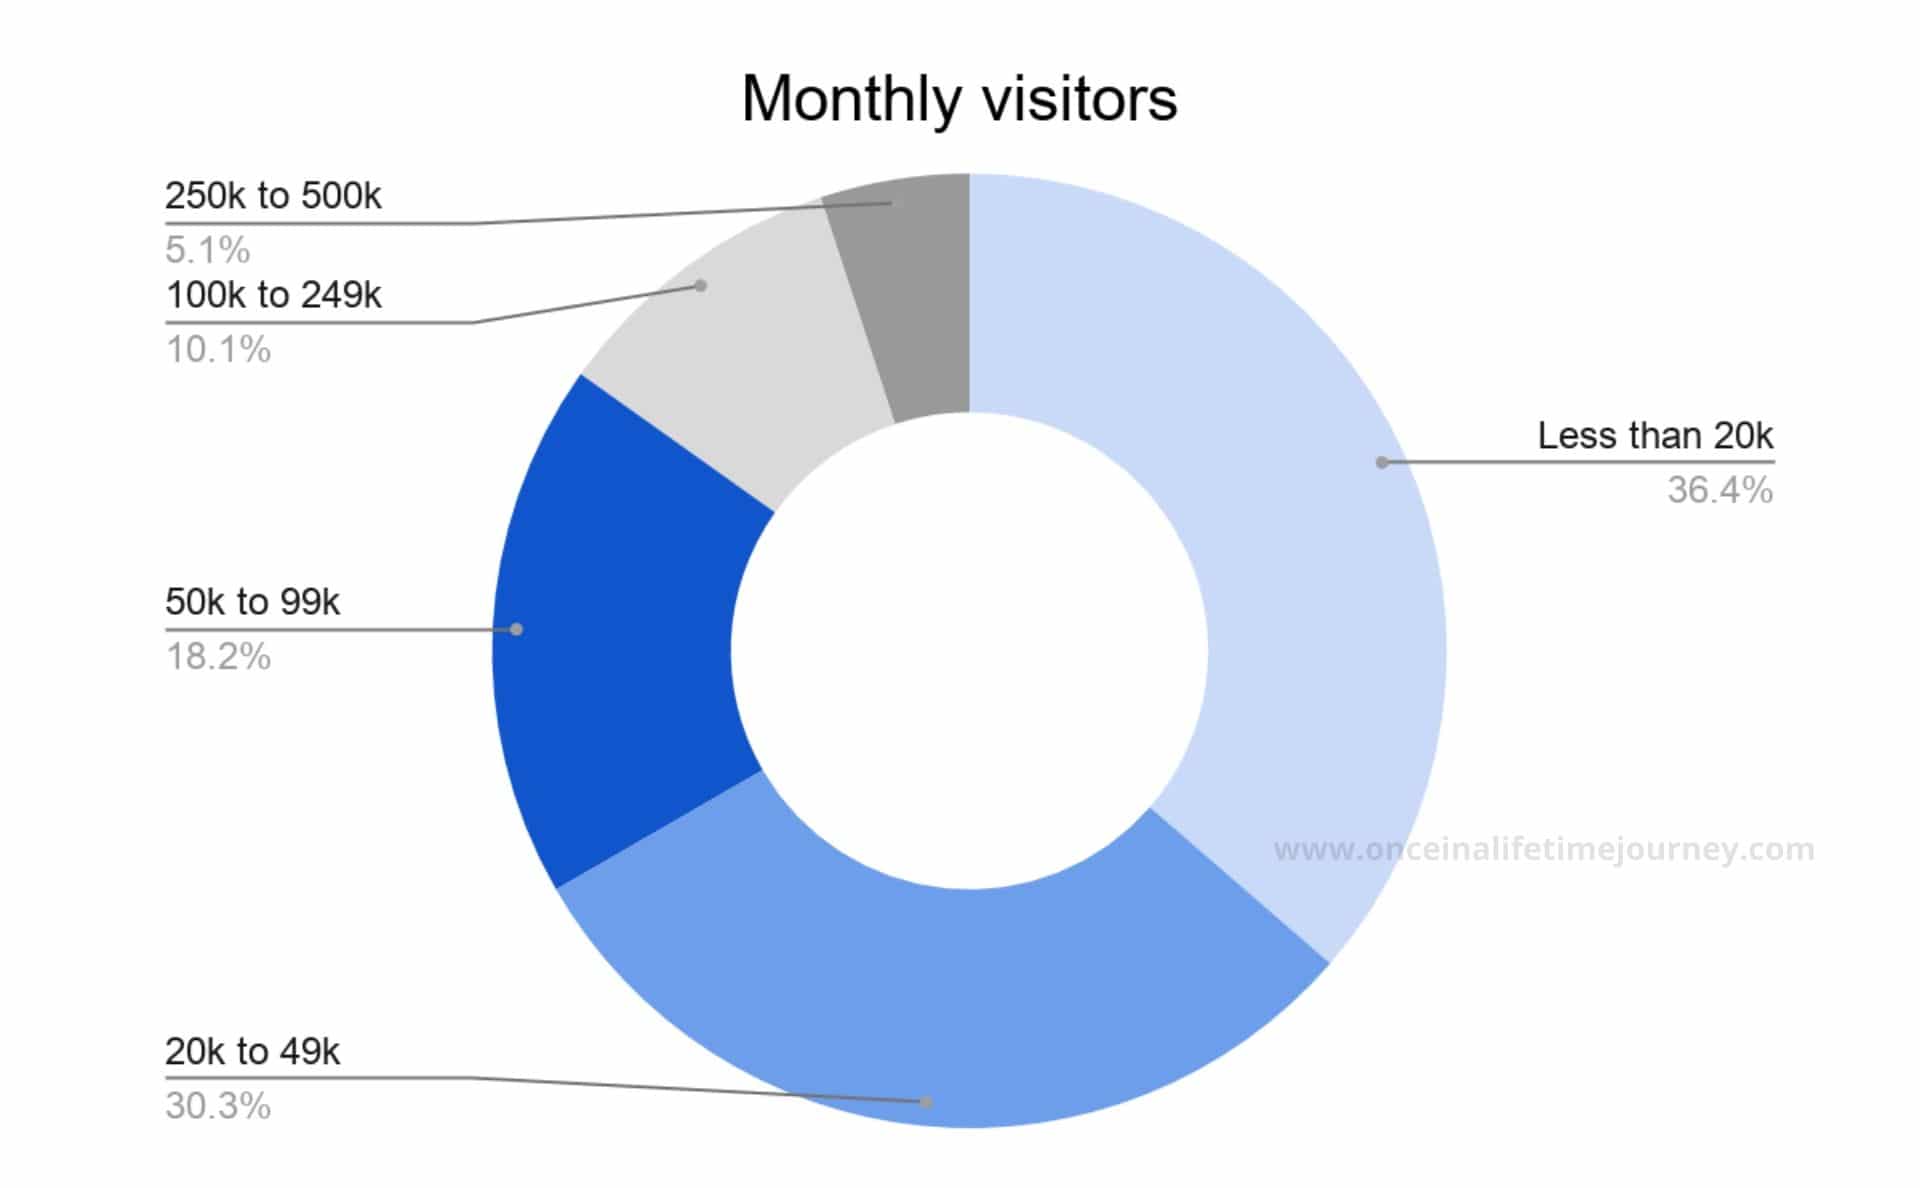
Content Creators in our sample had relatively large blogs. 15% had more than 100,000 monthly visitors and 39% less than 20,000. But were larger blogs able to generate higher income?
If we go back to the top-3 revenue sources (sponsored posts, affiliate commissions and advertising), it would be logical to assume that higher traffic should lead to higher revenues as these three types of income are directly correlated with traffic.
The graph below supports this hypothesis.
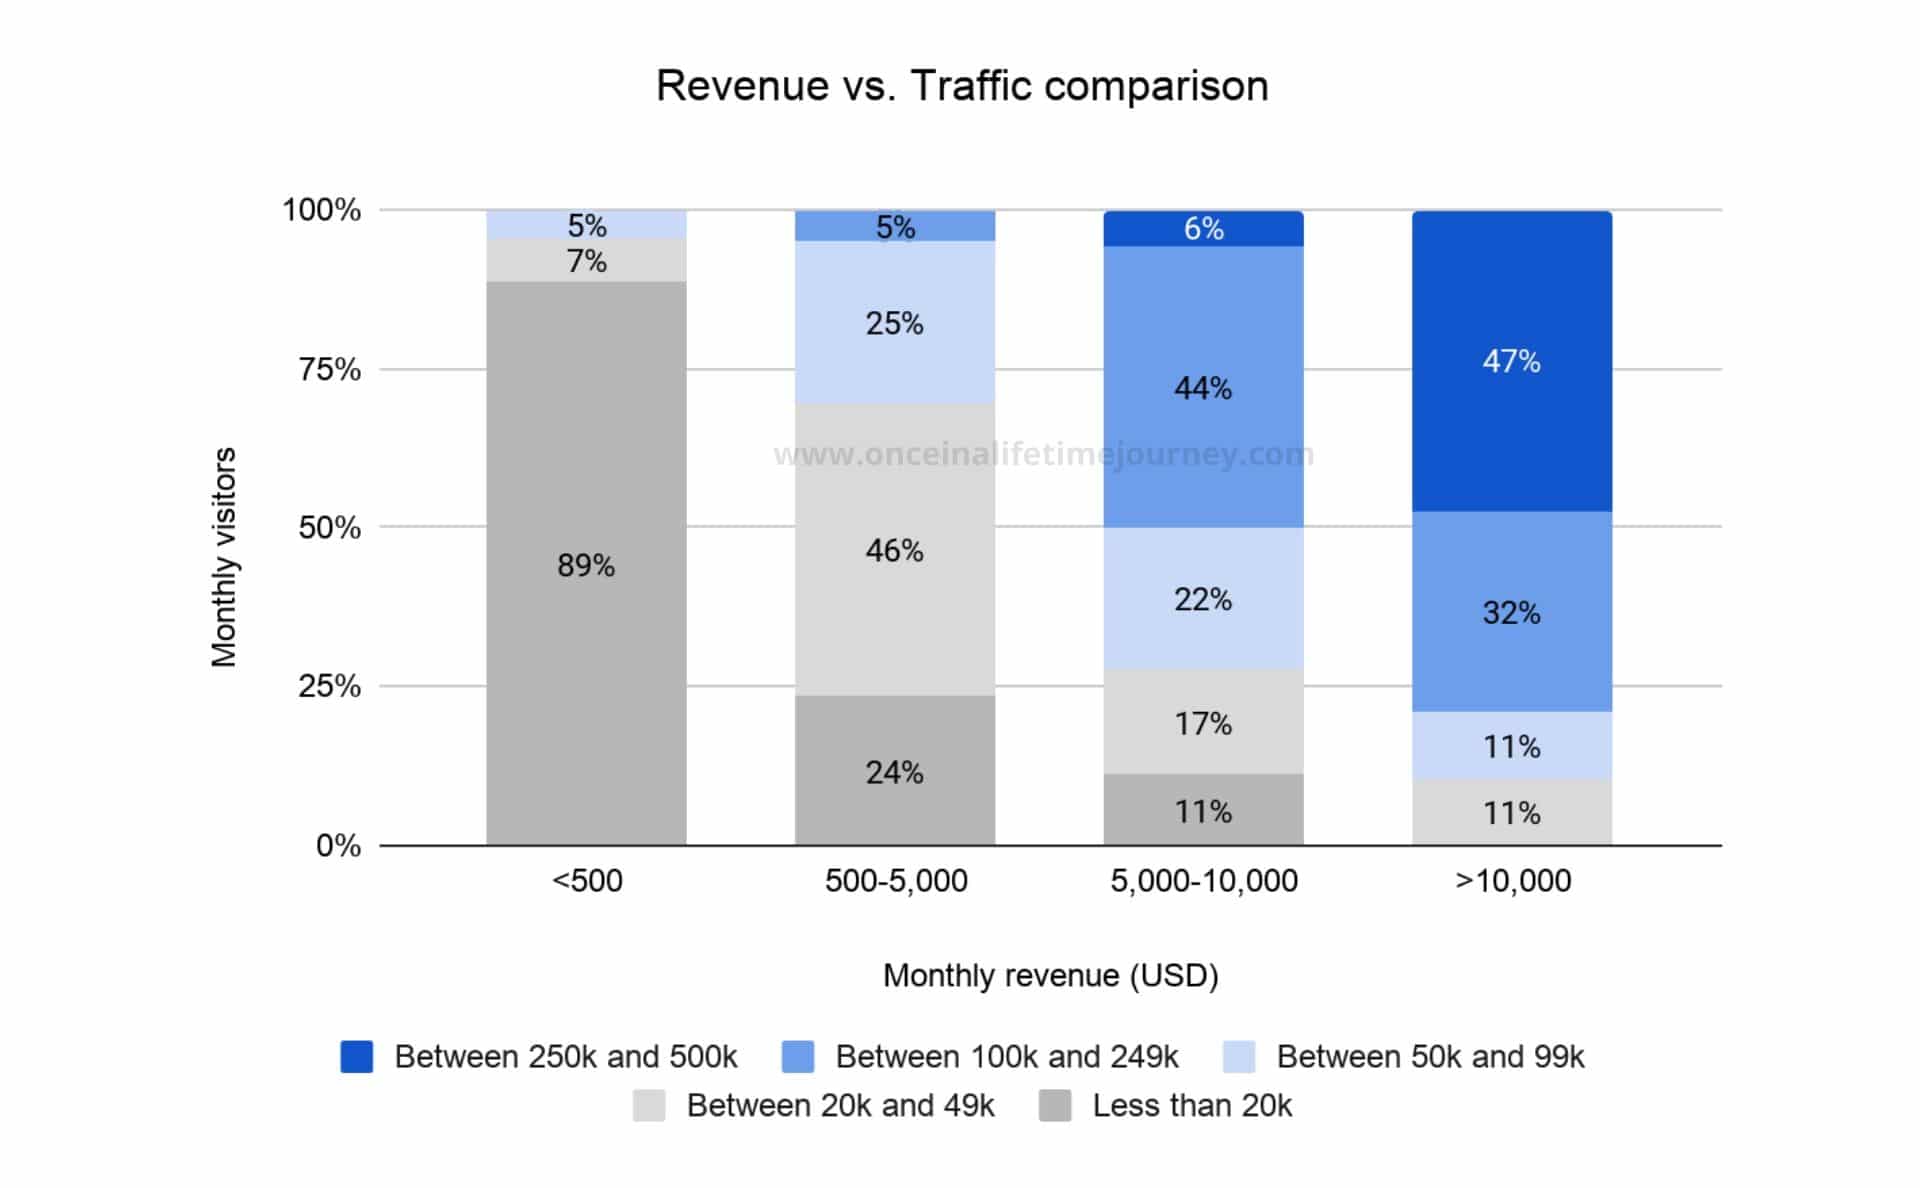
47% of the Content Creators generating more than $10,000 a month receive more than 250,000 monthly visitors. Conversely, 89% of the Content Creators who make less than $500 a month receive less than 20,000 monthly readers.
For those starting out, a rule of thumb would be: to make more than $10,000 a month, a blog’s traffic needs to be at least 100,000 visitors.
However, this generalization does not take into account niche sites. These specialized websites have been set up as monetization assets aimed at capturing user intent and can generate high amounts of revenues with small amounts of readers thanks to high conversion rates.
The correlation between traffic and revenue is the same, but the conversion rate and revenue per reader is much higher, so a smaller amount of traffic yields much higher revenues.
Does diversification guarantee higher revenues?
Like in the finance world where diversification is a common tool to hedge against the volatility of various investments within a portfolio, the world of online entrepreneurship uses diversification to combat unpredictability, seasonality and constant changes.
One could argue that specialization could be an alternative way to tackle the same challenges, by simply becoming the best at something specific.
We have seen that Content Creators in our sample diversify their revenue model with various sources, but is this a mere trial and error strategy or is it necessary? And does it also bring higher overall revenues?
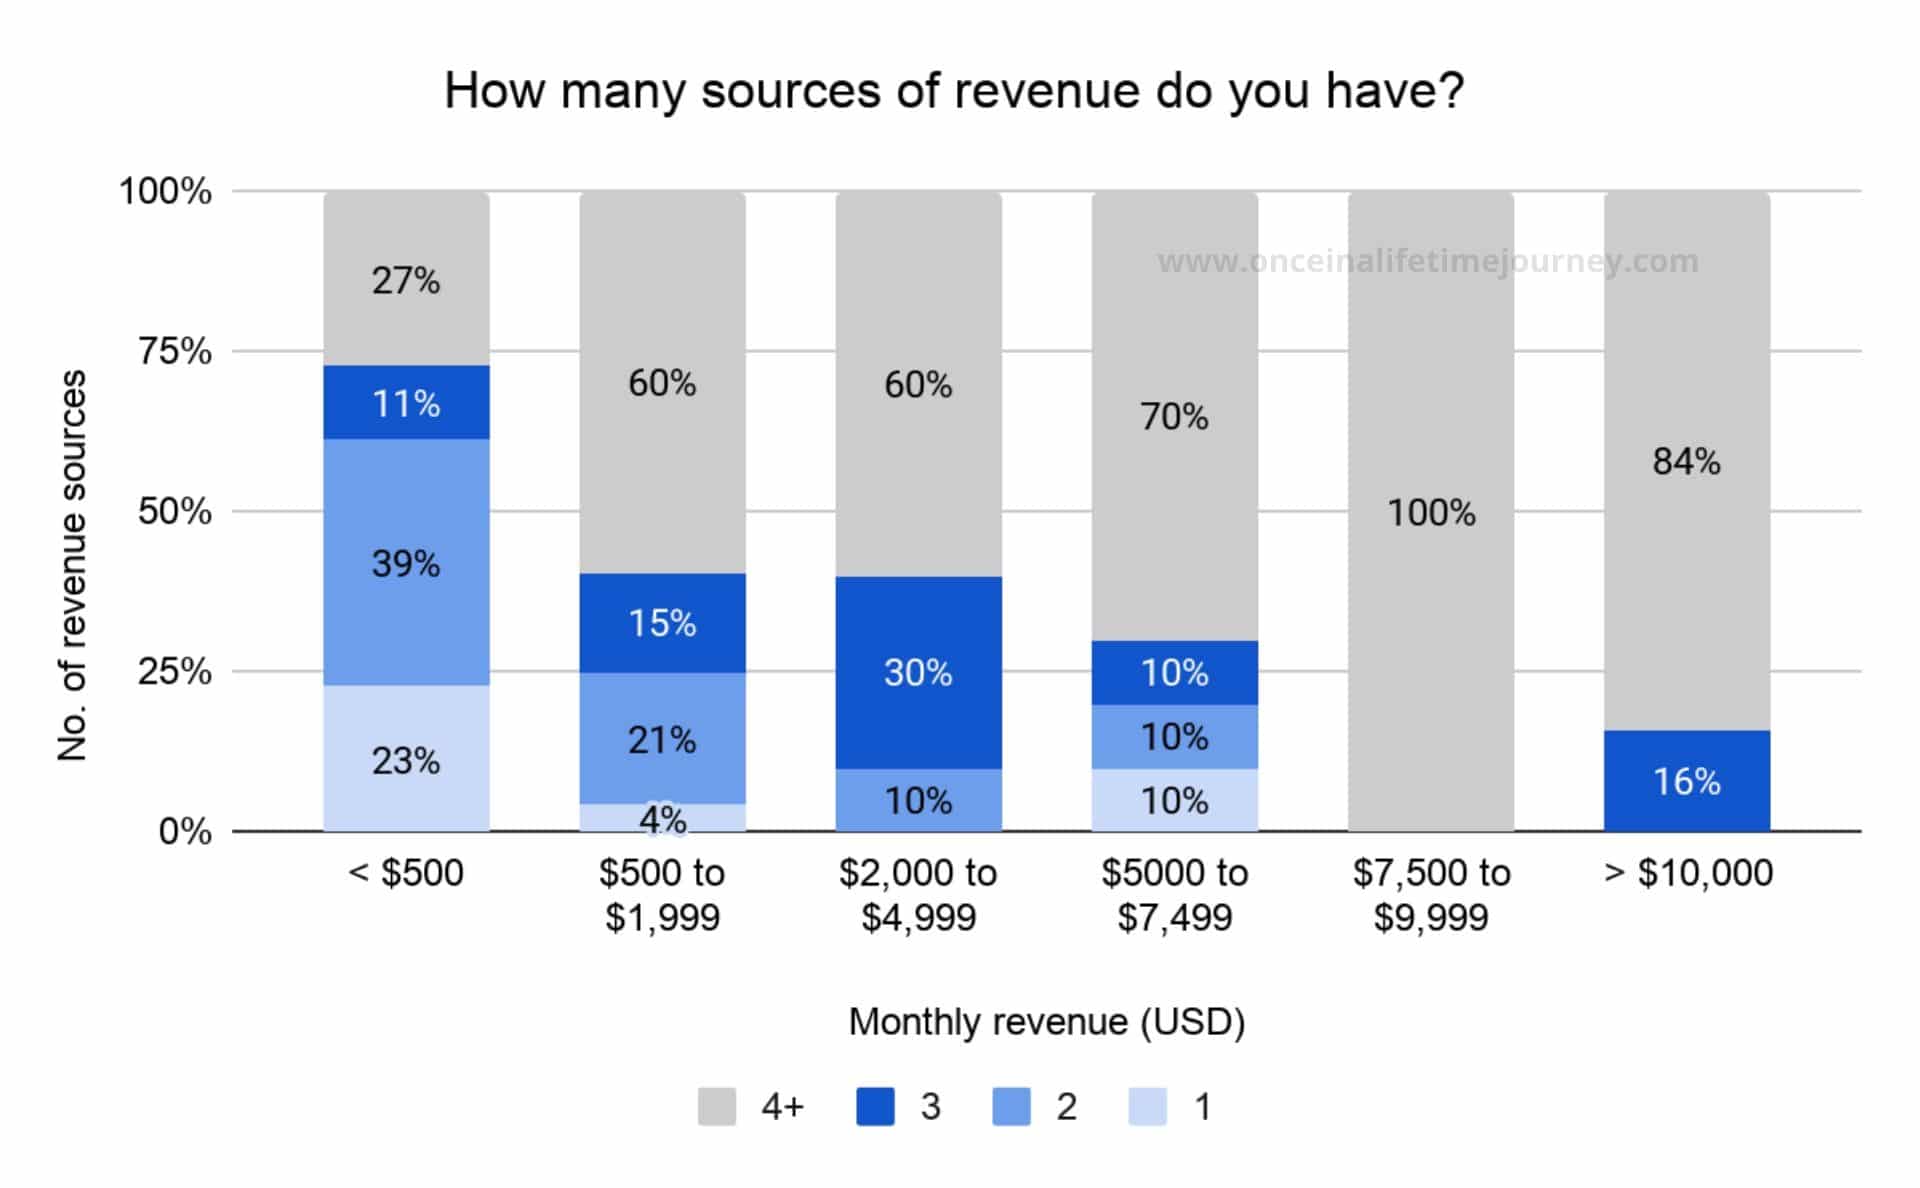
The survey responses indicate that those with monthly revenues above $7,500 draw revenues from more than 4 sources.
Anecdotally, we also know that not all Content Creators start their journey with all revenue sources but that, typically, there is a starting point (e.g. Link placements) and then other revenue streams are added.
Once a certain level of traffic or overall reach is achieved, advertising becomes a viable source of revenue and Content Creators are in a better position to proactively approach brands and add other active revenue streams.
Do most successful Content Creators work longer hours?
The graph below explores the relation between hours worked and the revenue generated and shows that those making more also work longer.
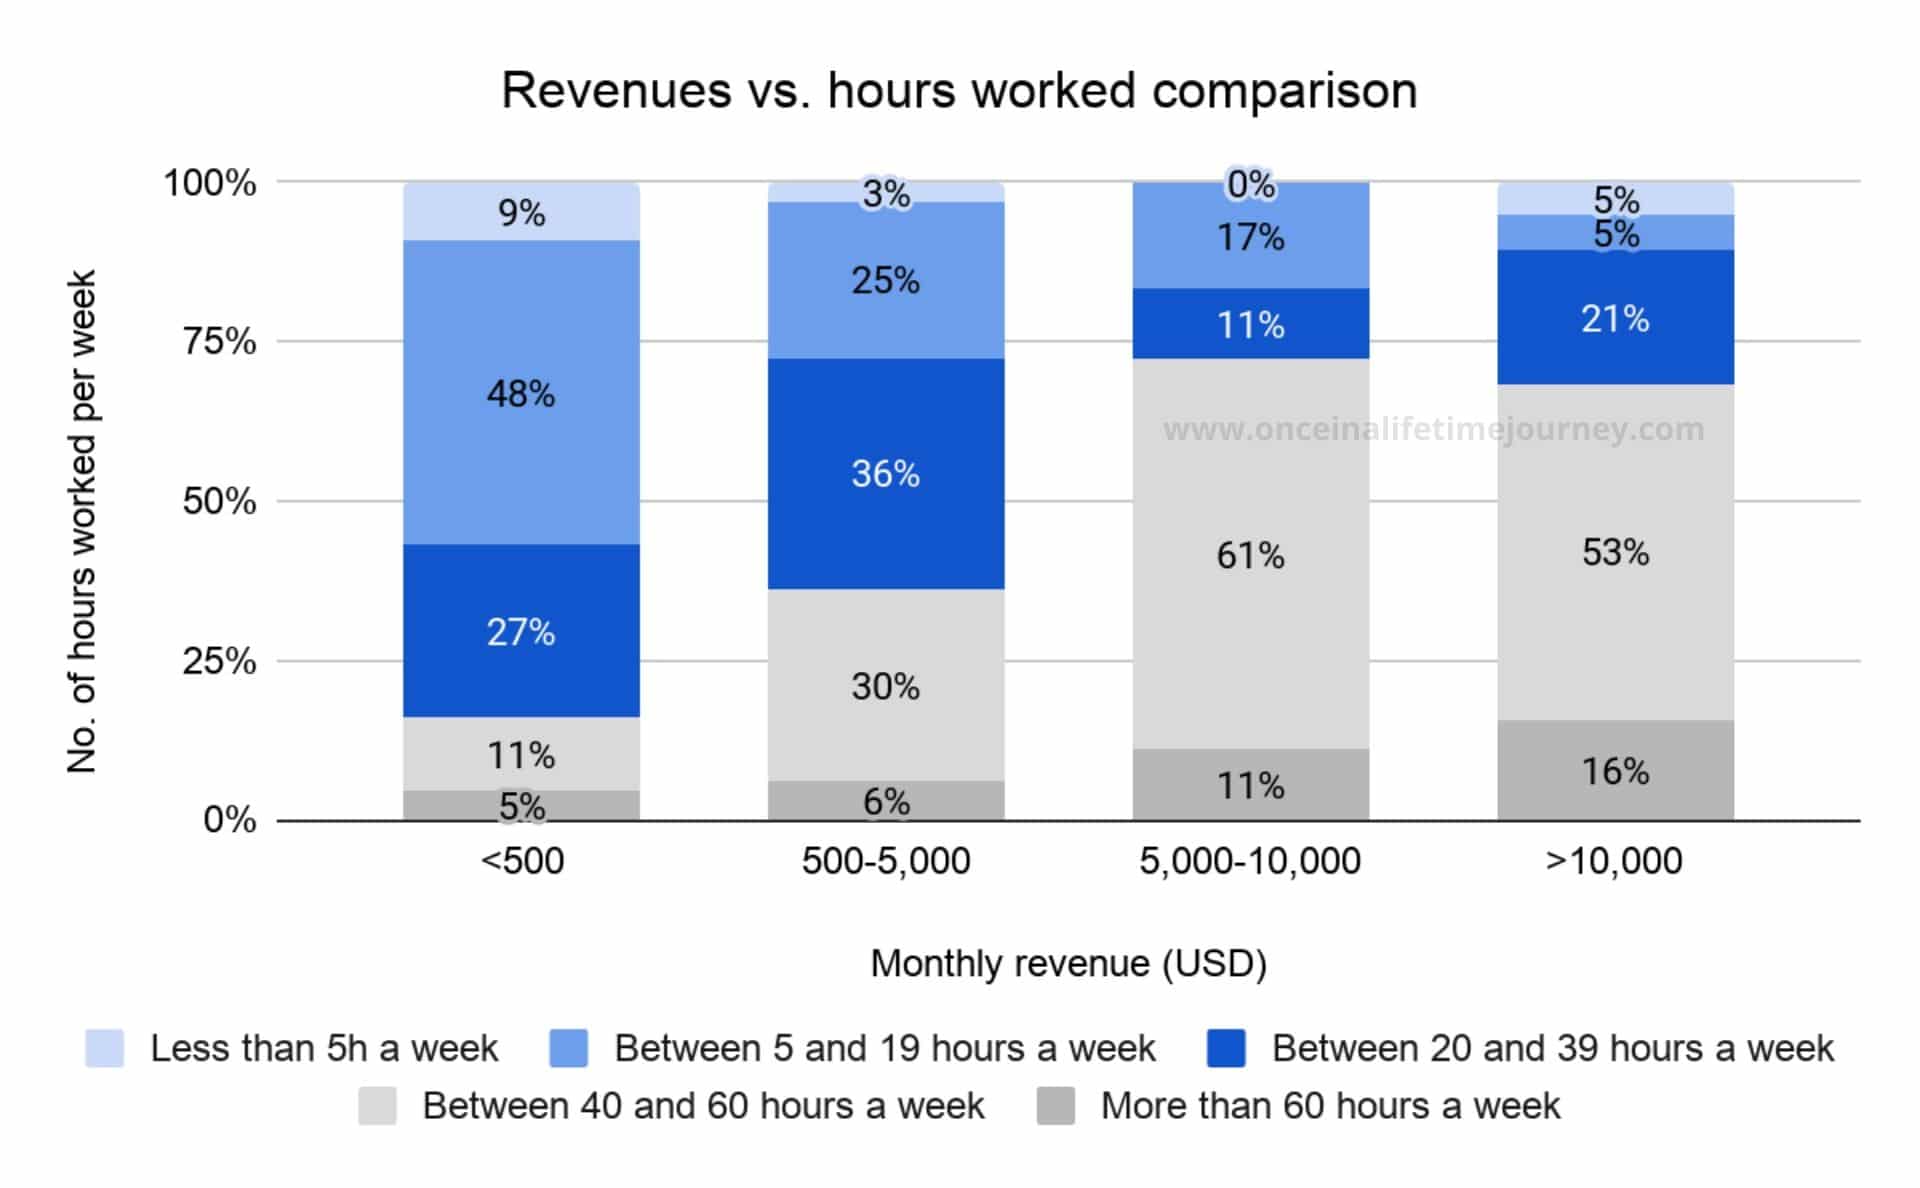
70% of those making more than $5,000 a week work longer than 40 hours and 80% of those making less than $500 work less than 40 hours a week. Part-time Content Creators would also be included here.
If the sample size in the higher end of the revenue levels was larger, my hypothesis is that we may also see a decrease in the hours worked.
Many Content Creators have a revenue target after which the focus turns into efficiency and reducing the overall hours worked to have a more balanced quality of life and freedom, rather than towards increasing the top-line revenue.
Higher revenues may also be an incentive to bring in teammates, outsourcing or hiring, reducing the number of hours the Content Creator works.
Online presence vs. time spent online
One of the frequently asked questions by beginner bloggers is how many articles are required and how often to publish and engage on social media.
In particular, for those who are more of a blogger and less of a content creator or influencer, the question of how much time to devote to social media is a recurrent one.
Let’s first look at how many articles do those earning most have.
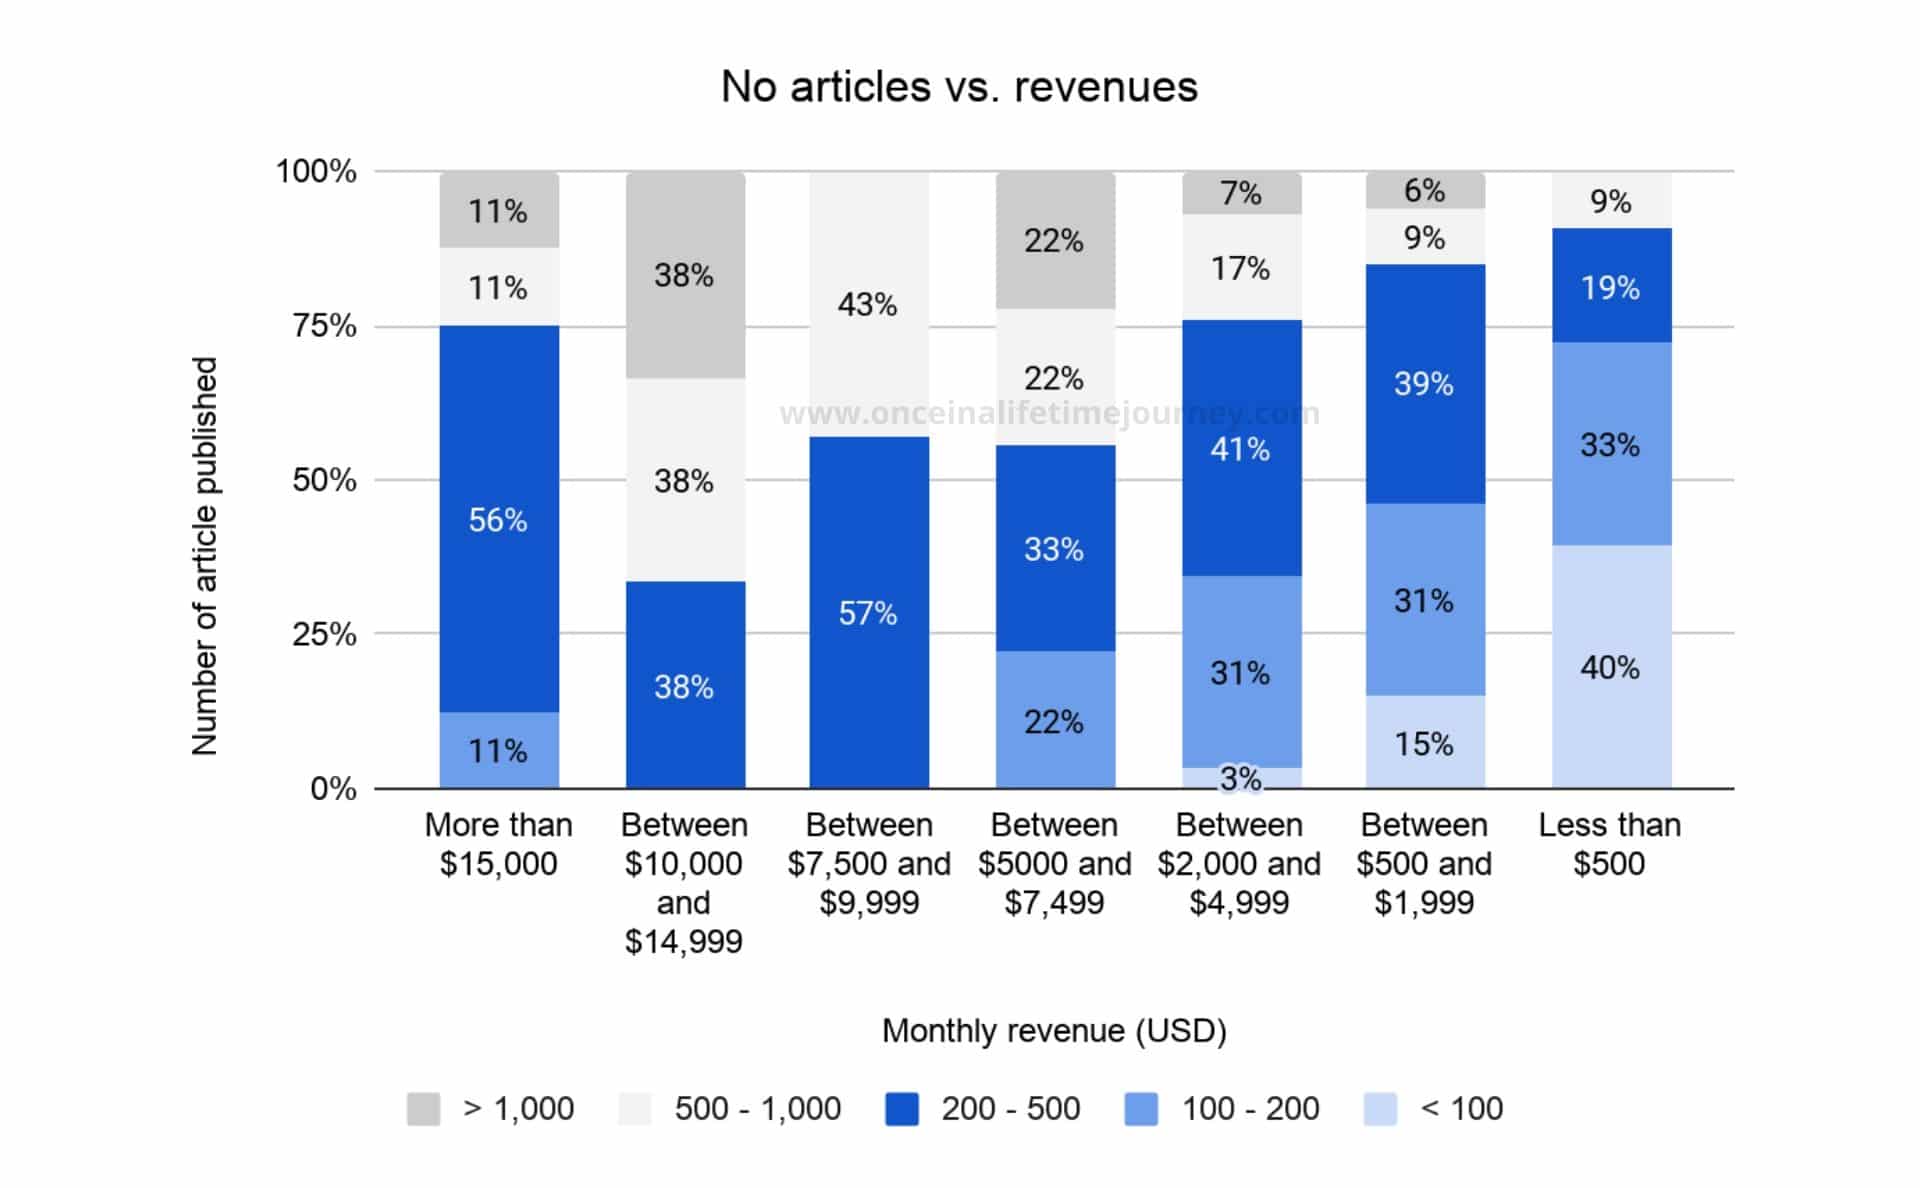
There seems to be a correlation between the number of articles written and the revenues generated. Again, this reflects the fact that the majority of the Content Creators generate revenue via passive means where higher traffic usually means higher revenues.
Campaign amplification
In 2019 I spoke at a few industry conferences about how much value brands leave on the table for not amplifying the impact of a Content Creator collaboration.
I wanted to see if my personal experience and that of my peers in Asia, a relatively unsophisticated market when compared to the US or Western Europe, was representative of the global reality.
To do that, we included several questions in the survey that asked about client interaction with the content produced.
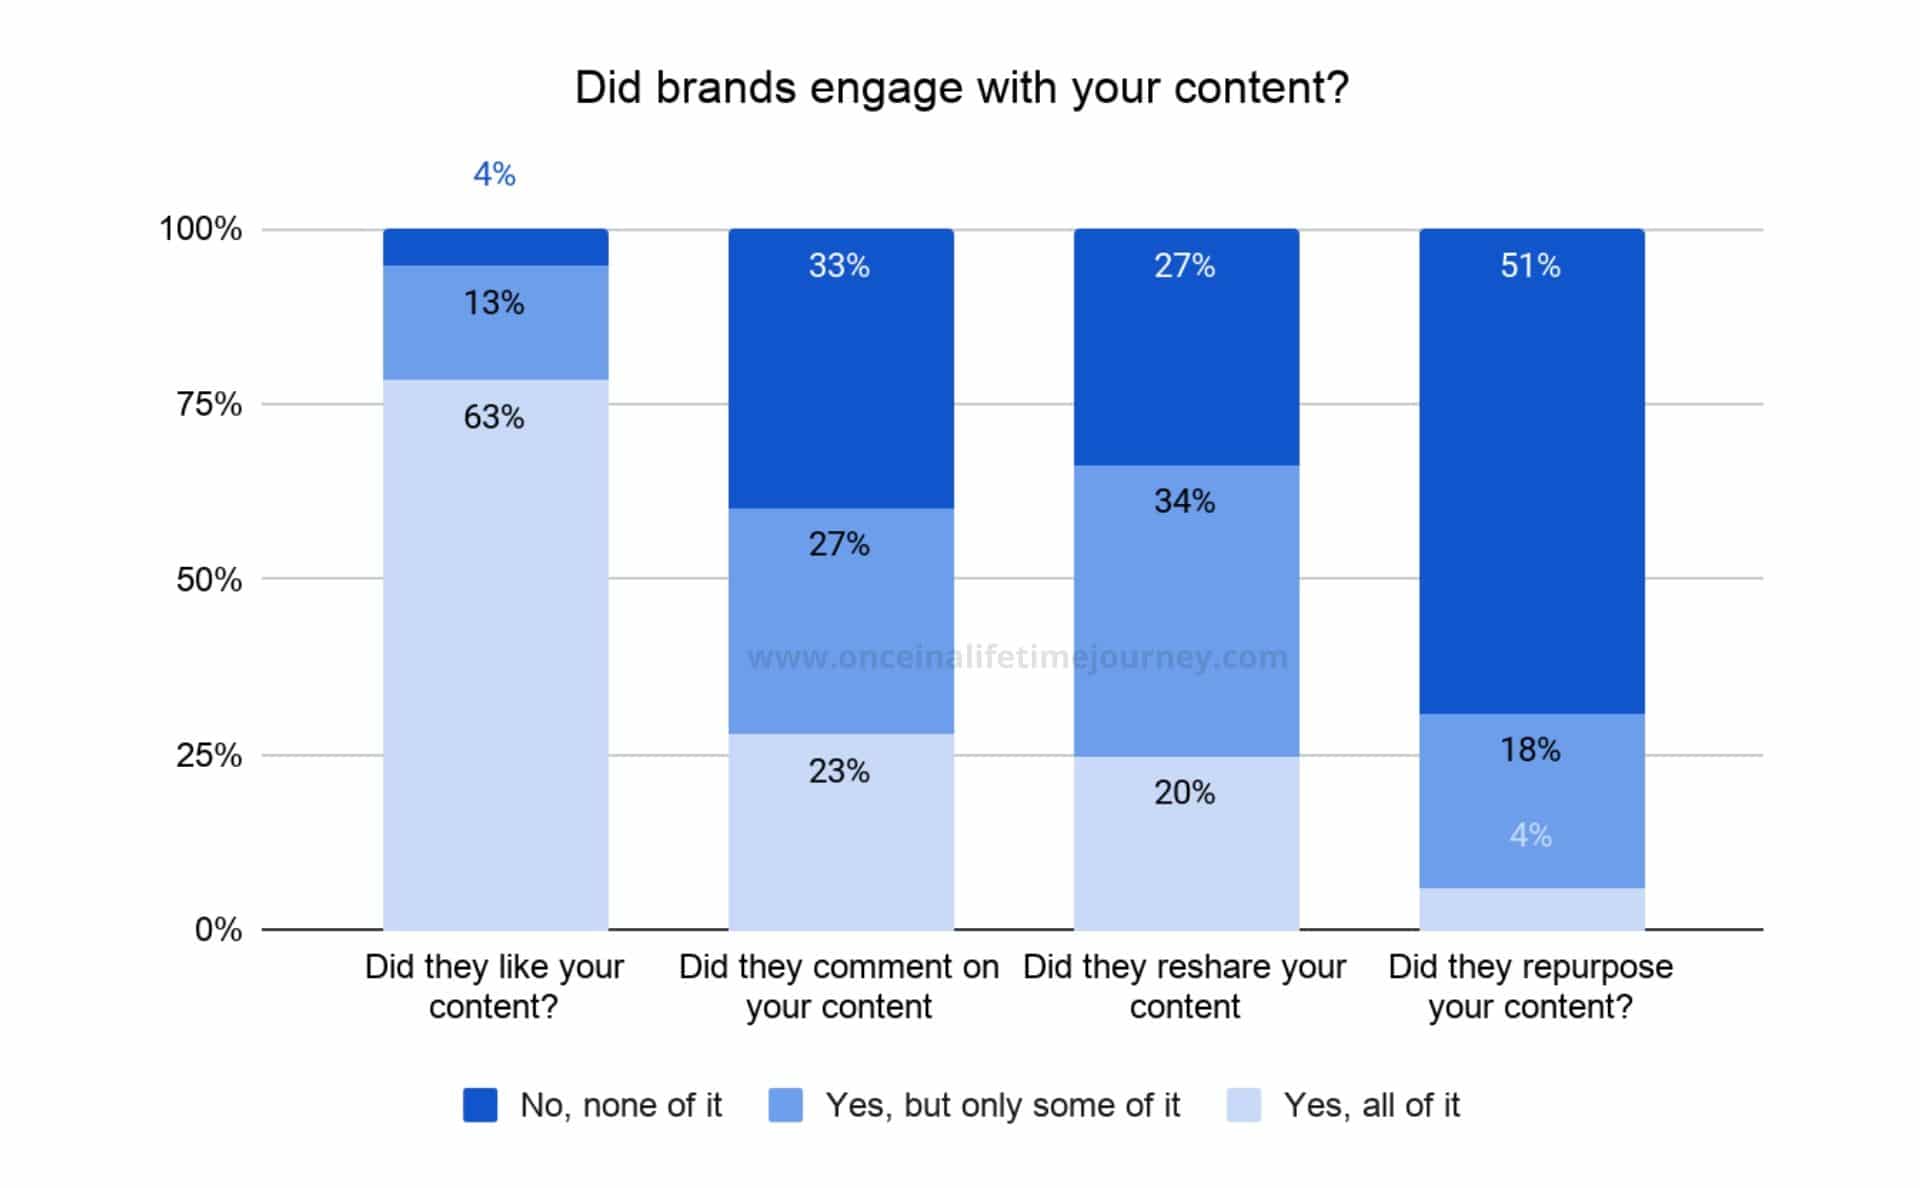
While the majority of the brands at least “Liked” the content produced as part of a collaboration acknowledging the content and interacting with it, 60% didn’t comment or reshare all of it, with close to 30% not engaging at all with the content produced.
This could be due to the type of content produced. Not all the content produced by a Content Creator may be suitable for the brand’s channels. The fact that it was created for the Content Creator’s feed does not mean that it follows the brand’s aesthetic or identity guidelines.
However, the most sophisticated and professionalized brands will discuss this upfront and may reach an agreement with the Content Creator to maximize alignment so the content can be reshared.
Not doing so is a lost opportunity for brands to get more than just the promotion on the Content Creator’s platforms.
There is a fine line between dictating the details of a campaign for a Content Creator and aligning it with the brand’s values.
When looking at the percentage of brands that repurposed the content produced, over half of the Content Creators stated that the brands did not.
This is in contrast with the 2019 Influencer Marketing survey run by Activate whose sample of Brand Marketers declared, in 83% of the cases, that they repurposed the materials produced by Influencers for online paid ads, retargeting or for programmatic instances.
In my experience, the most successful campaigns align the Content Creator’s objectives with those of the brand.
They have a long term horizon and a multi-year approach to the return on investment, with content produced for the Content Creator’s channels and for the brand’s, and assets repurposed as digital marketing tools.
All of this with fair retribution for the Content Creator that considers not only the reach and return provided but also the value of the assets produced.
As we saw earlier, most Content creators are creative directors, producers, videographers/photographers, actors/actresses, writers, copywriters and publishers all at once.
Reporting
As the industry professionalises, reporting on results becomes the norm, both internally for the Content Creator’s own use, as well as externally for the brands.
External reporting for brands
Most influencer marketing networks provide detailed reporting and use it as their main selling proposition. However, we saw when looking at how Content Creators find opportunities that these rarely come from these platforms but directly from brands/PR contacts.
When the opportunities don’t come through these marketplaces, do Content Creators provide any reporting by default?

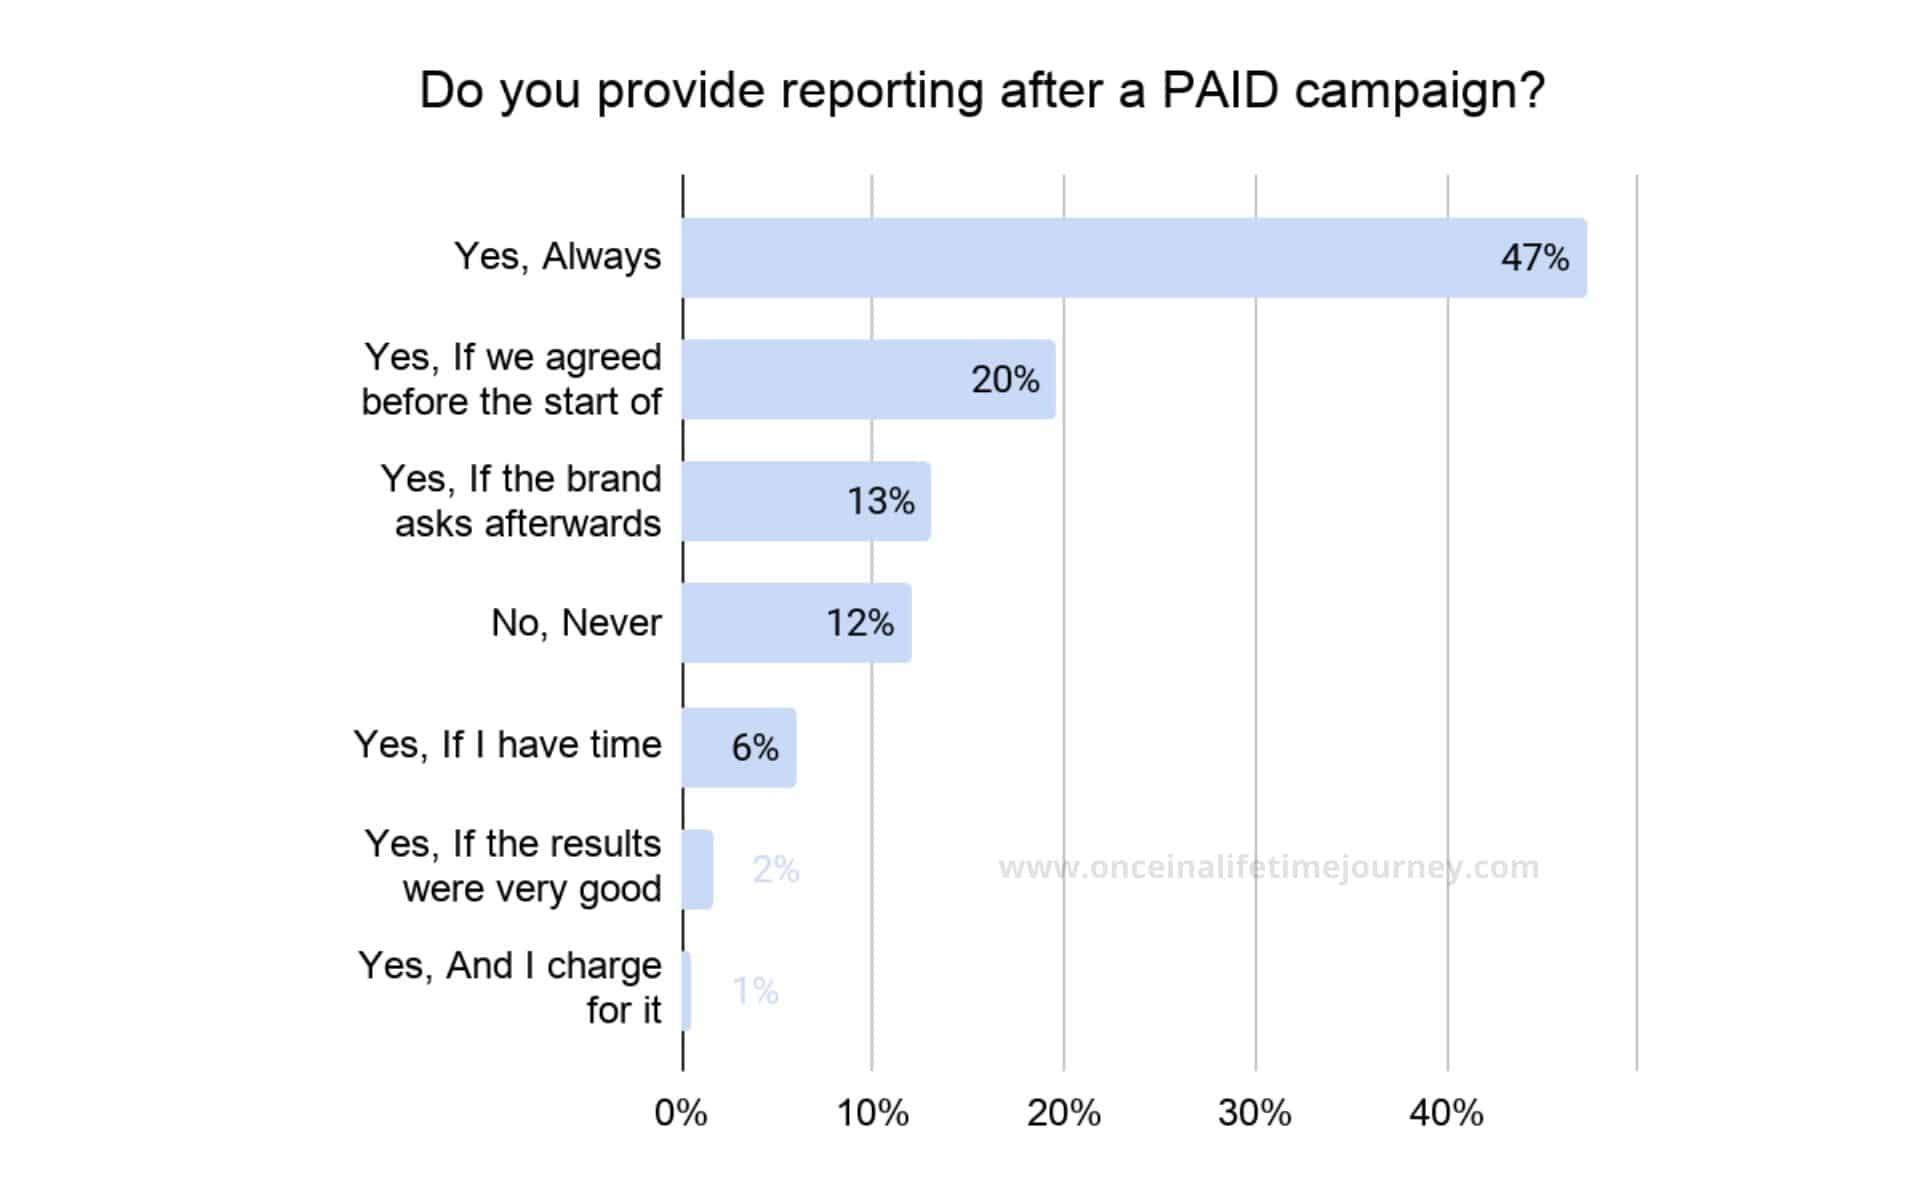
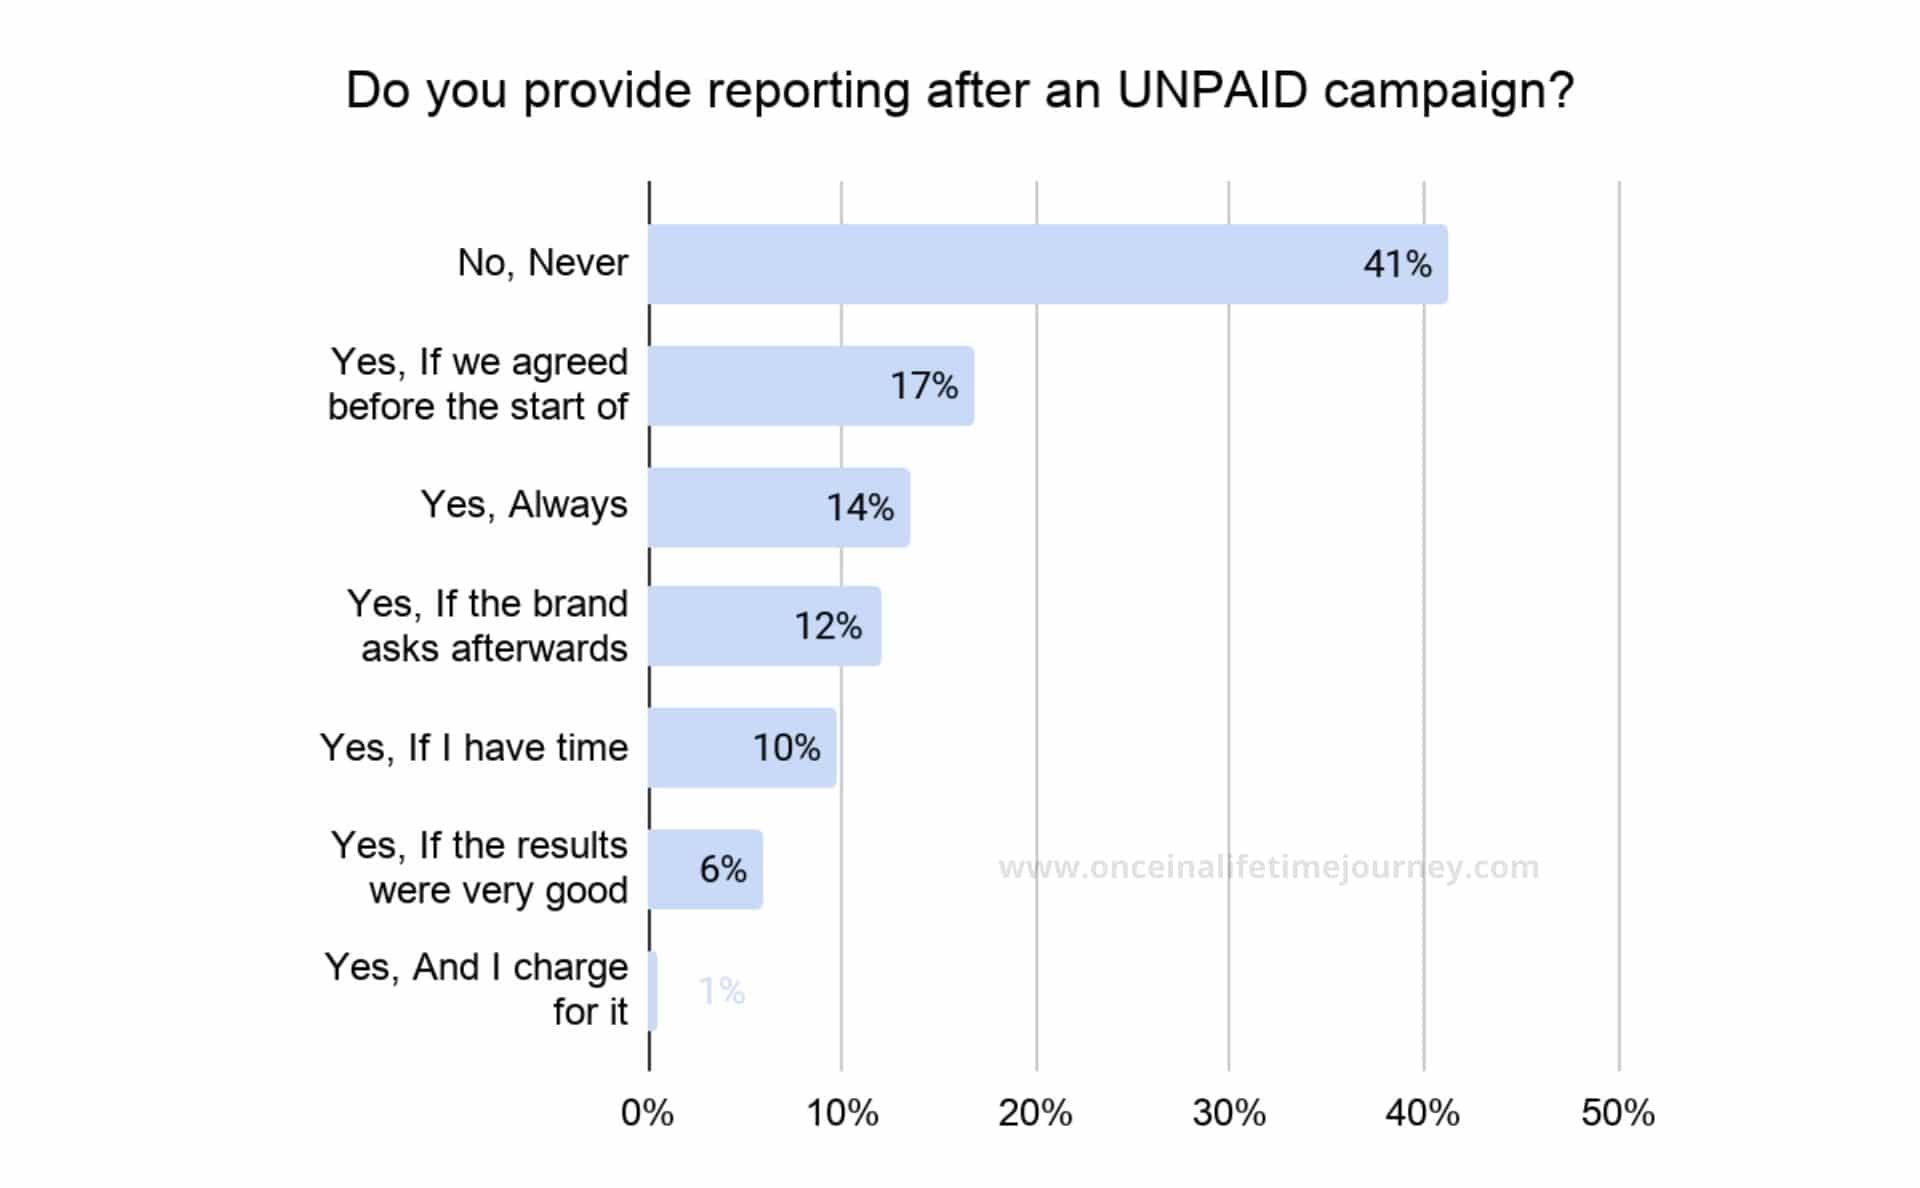
Reporting after a paid vs unpaid campaign
Around half of the respondents indicated that they always provide brands with reporting after a paid campaign ends.
However, when the campaign is unpaid, reporting is provided in 14% of the cases only, unless agreed otherwise.
Because there isn’t a unified or industry standard tool to provide reporting, every Content Creator uses different combinations to illustrate the results. These are the most common tools used.
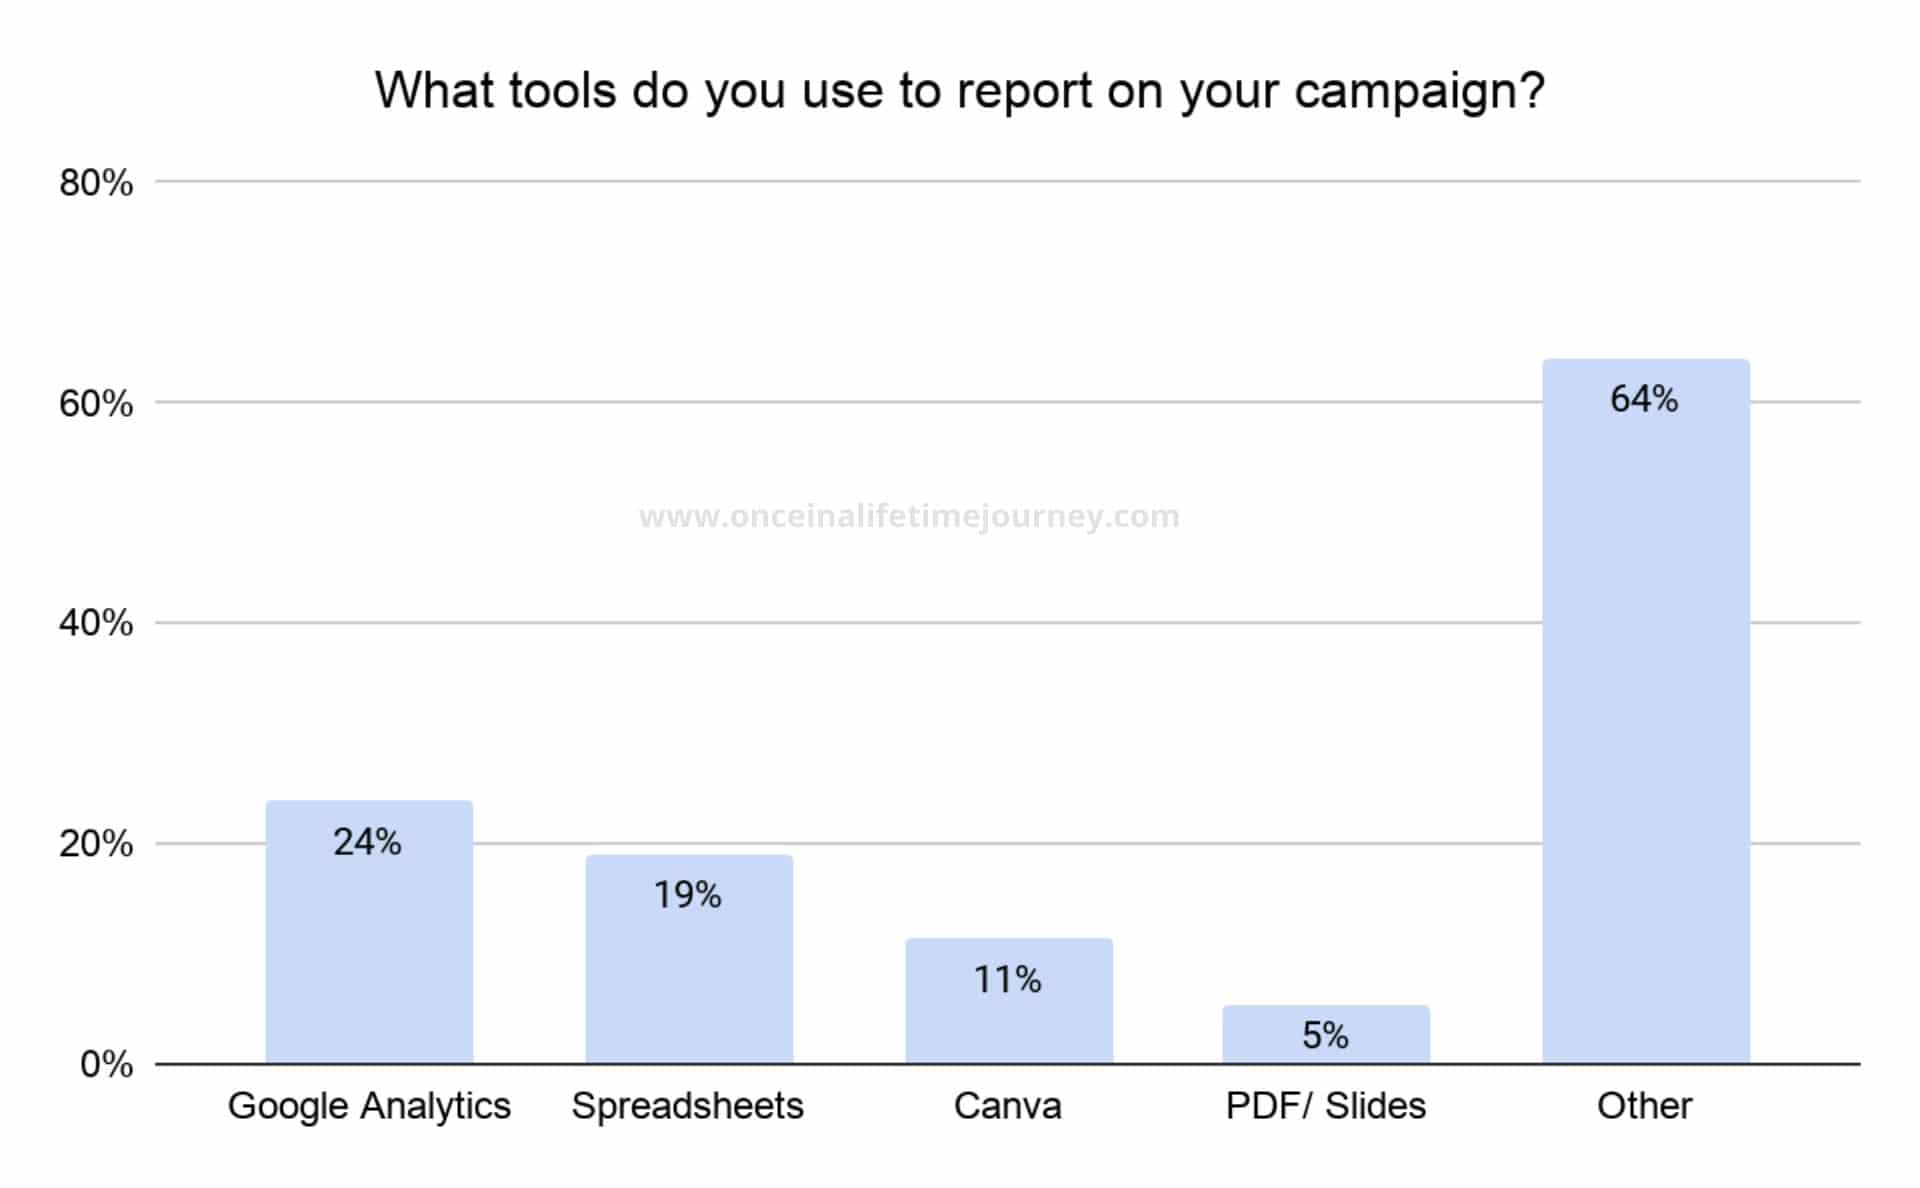
Besides Canva (with its pre-designed reporting templates), PDF files of documents, spreadsheets and Google/Social media Analytics, there were mentions of standardised tools such as Wakelet, which helps curate the online content created in visually appealing libraries.
Beyond reporting, only 8% of the Content Creators create case studies after every campaign and half don’t ever create them.
Internal reporting and business tracking
Only 36% of the respondents compile monthly reports on progress for their own use. However, the majority will keep an eye on the main progress drivers.
Since there isn’t a unified tool that compiles all of these under one roof, most respondents check several sources. The most commonly used tools are the ones below.
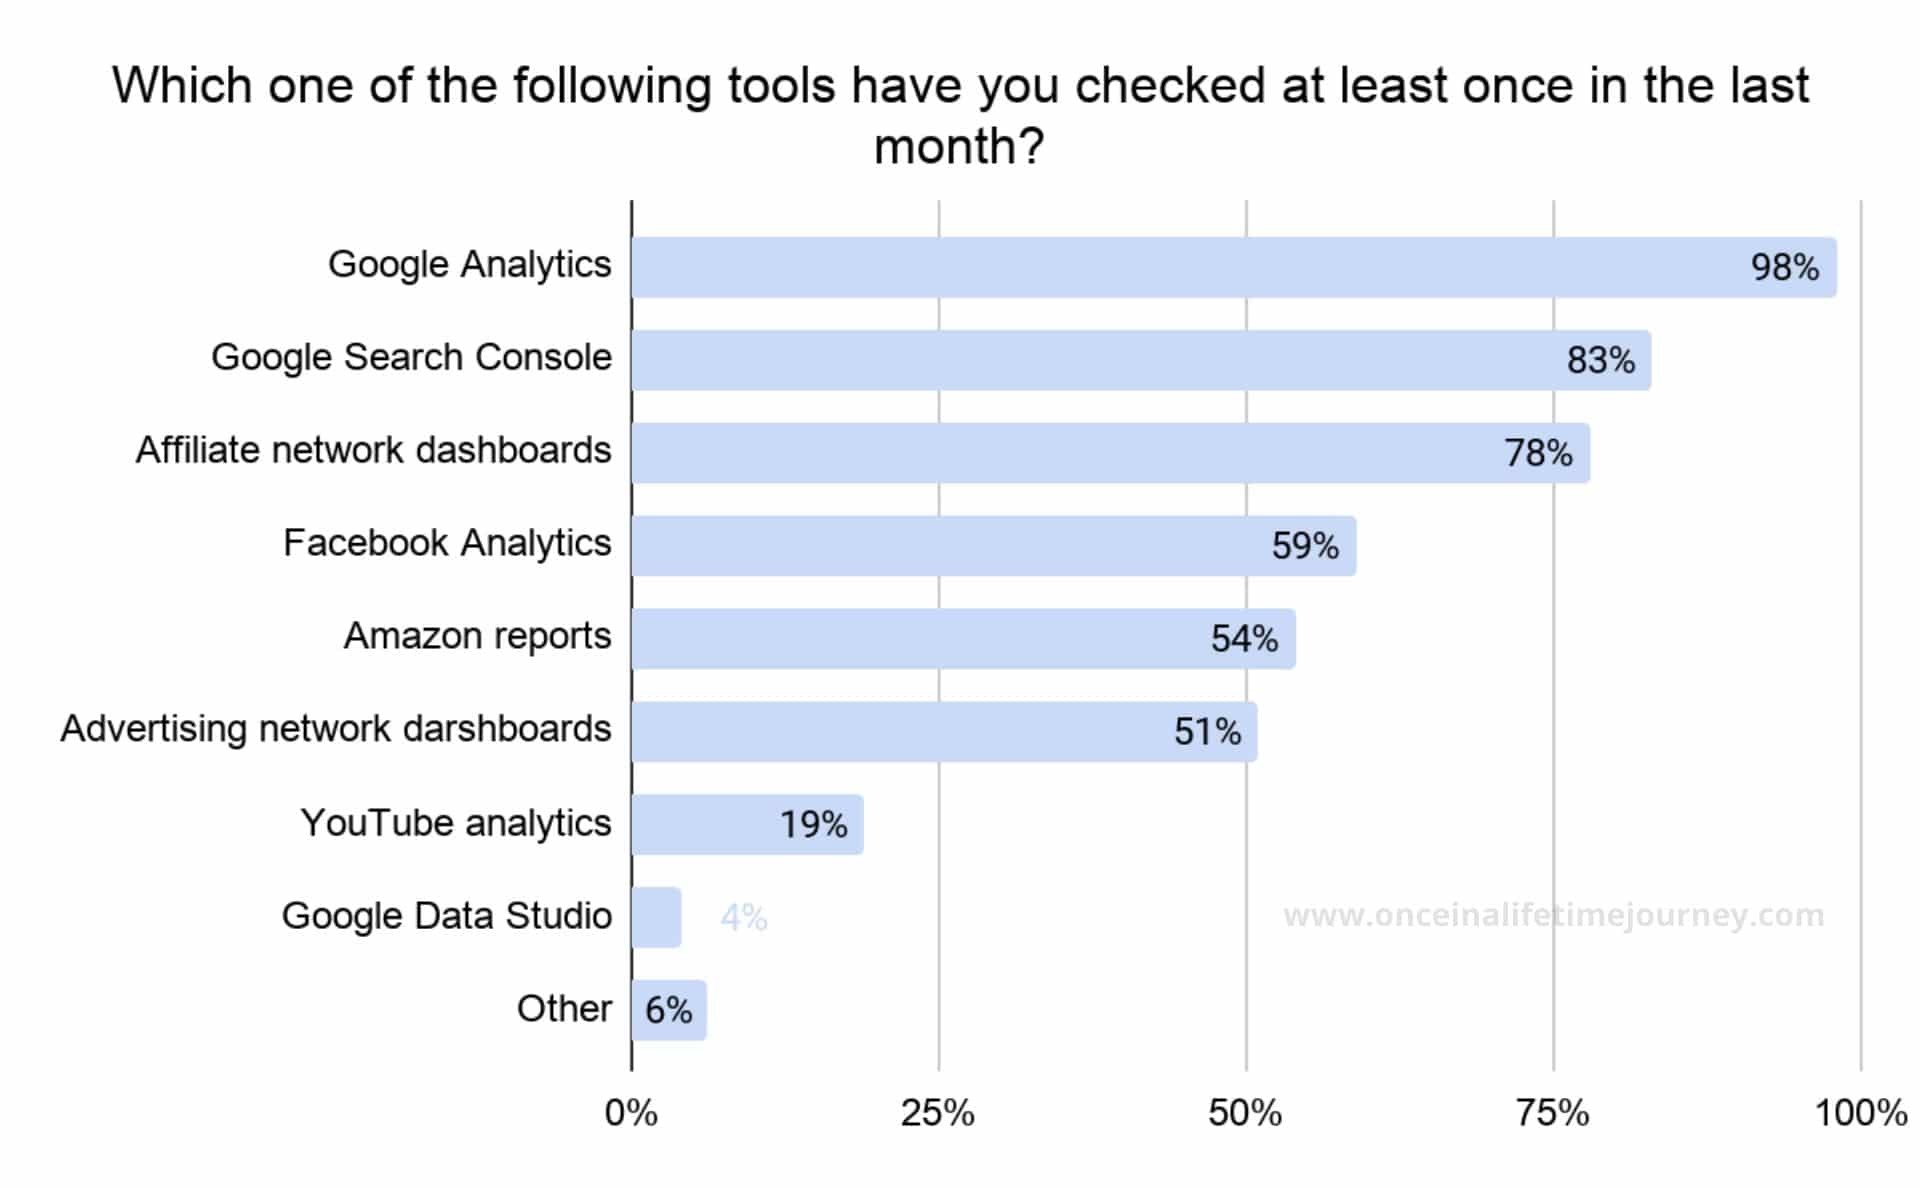
These platforms, and others, are used to track the key drivers of the business on a monthly basis.
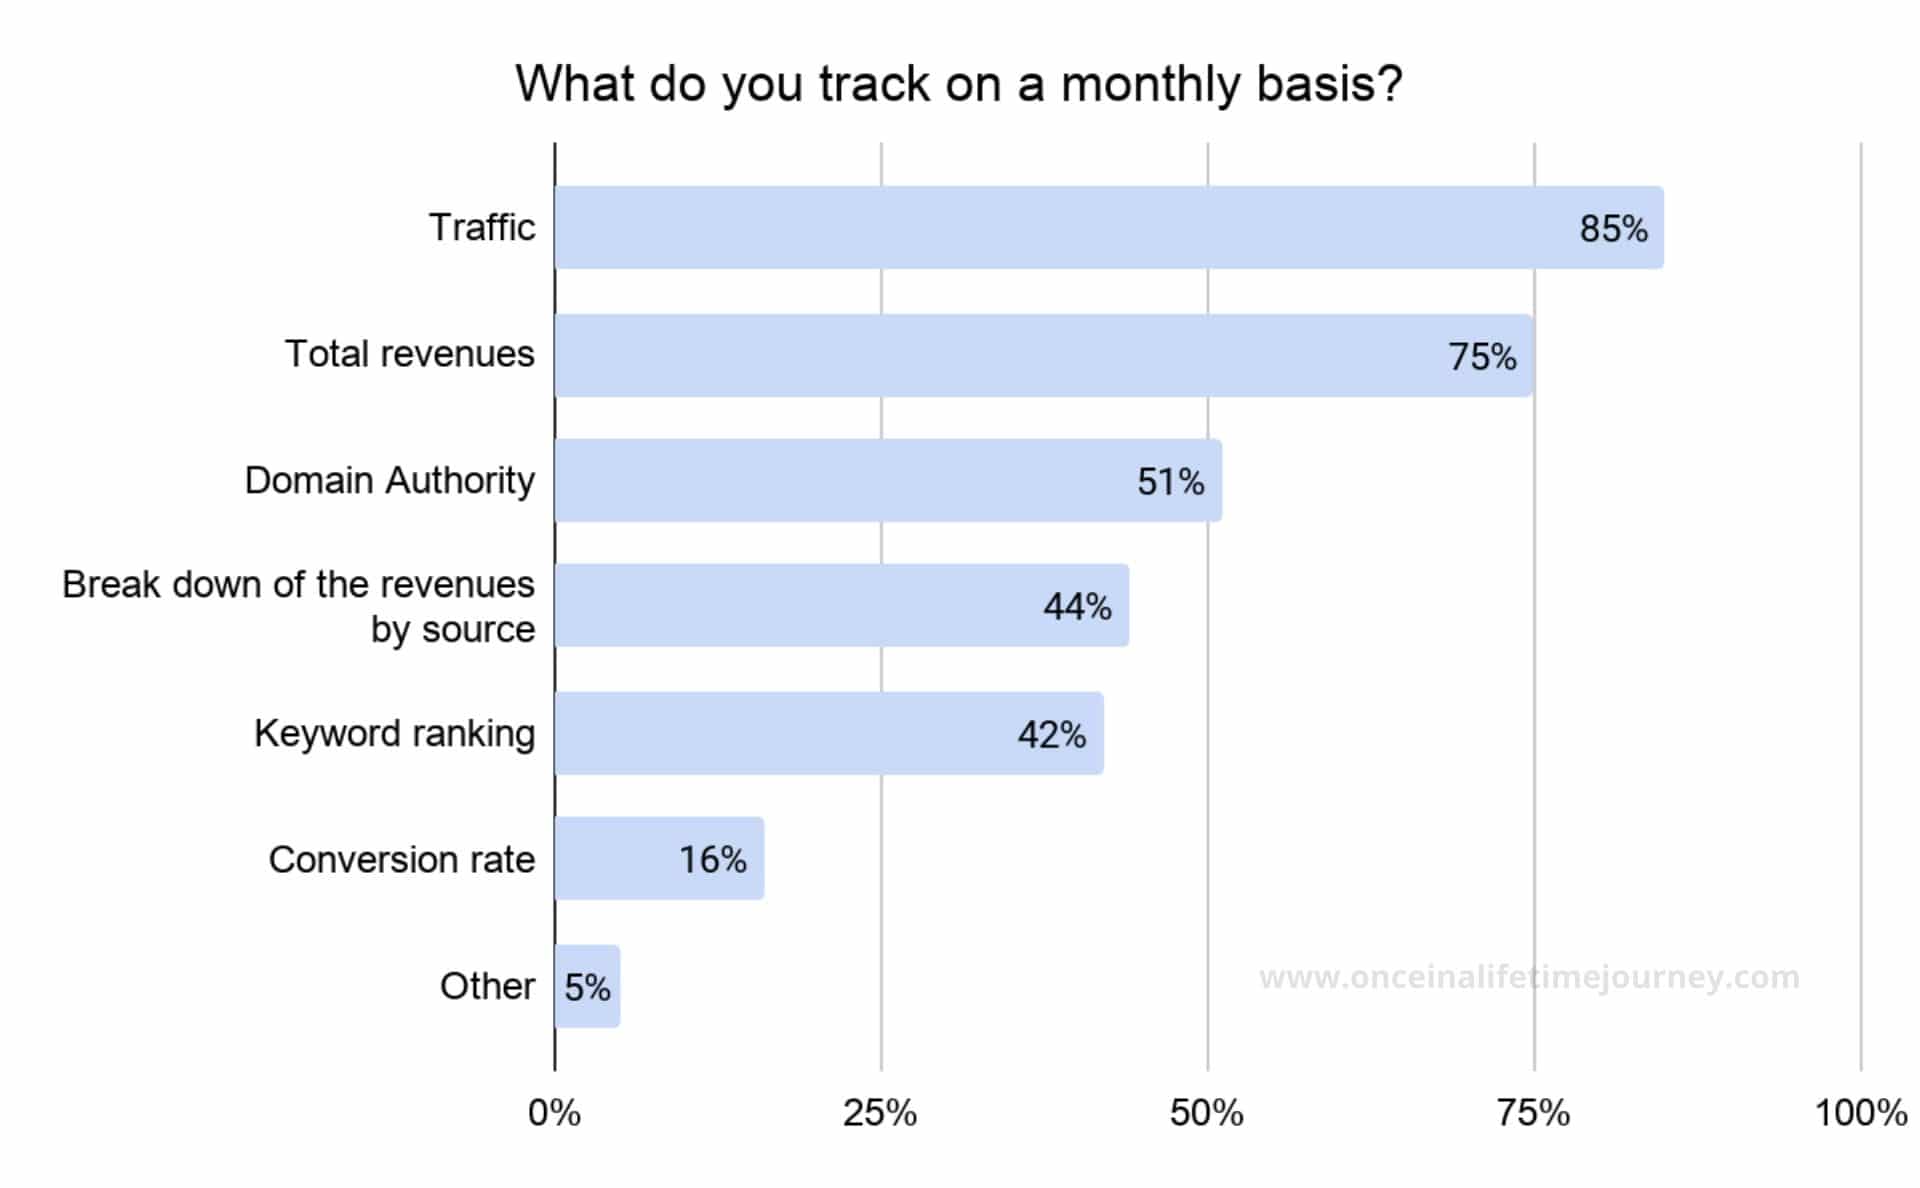
85% of the Content Creators track traffic and this is the most important metric for the respondents in our sample, ahead of revenues which were tracked by 75% of the Content Creators.
What is interesting is to see the various combinations of metrics tracked as there is no alignment between the Content Creators.
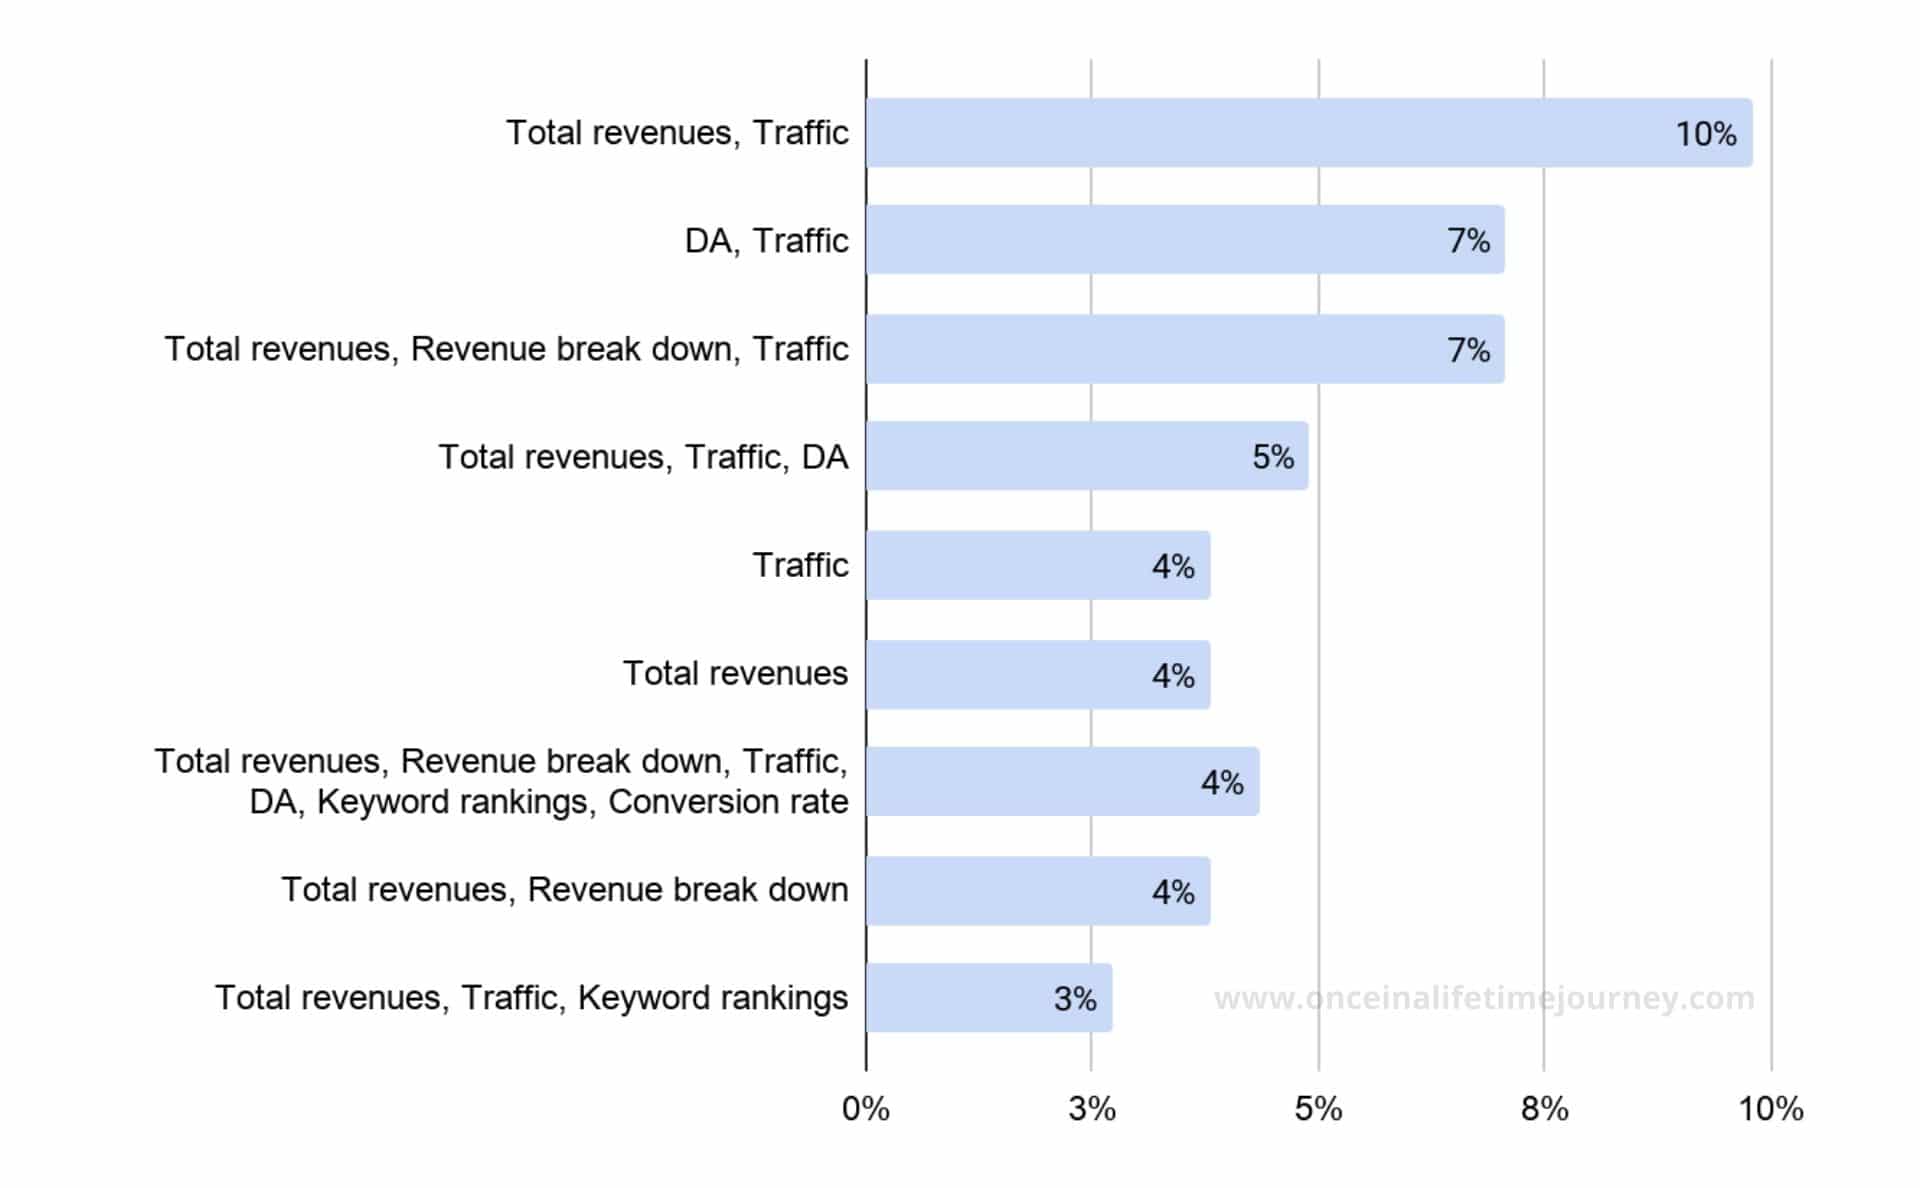
Of the six metrics offered, there are dozens of combinations tracked. The most popular combination is revenues and traffic which are tracked by 10% of the sample. Beyond this, there are almost as many combinations as Content Creators.
Looking at the above insights it is clearer that there is no industry standard for how to manage the business side of content creation, something which would be facilitated if there was a universal tool used.
Disclosure
As the content creation industry evolves, so does the regulation around it.
Following several articles highlighting the lack of disclosure of Influencers across platforms, the Federal Trade Commission (FTC) and similar regulatory bodies in the UK and Australia, issued or clarified their guidelines for disclosure of brand collaborations, both on social media as well as on online publications.
These were not new, the FTC had first issued them in 2013, but given the widespread lack of compliance, the rules have been simplified and been made more understandable to the layman (even with infographics).
We wanted to know if Content Creators have caught up with the times and were aware of the regulations that applied to them.
77% of the Content Creators in our sample answered, “Yes I am aware of the disclosure requirements and know how to apply them”.
We then compared answers to “Are you aware of the disclosure requirements that apply to you?” with “Do you apply them on social media/your articles?”.

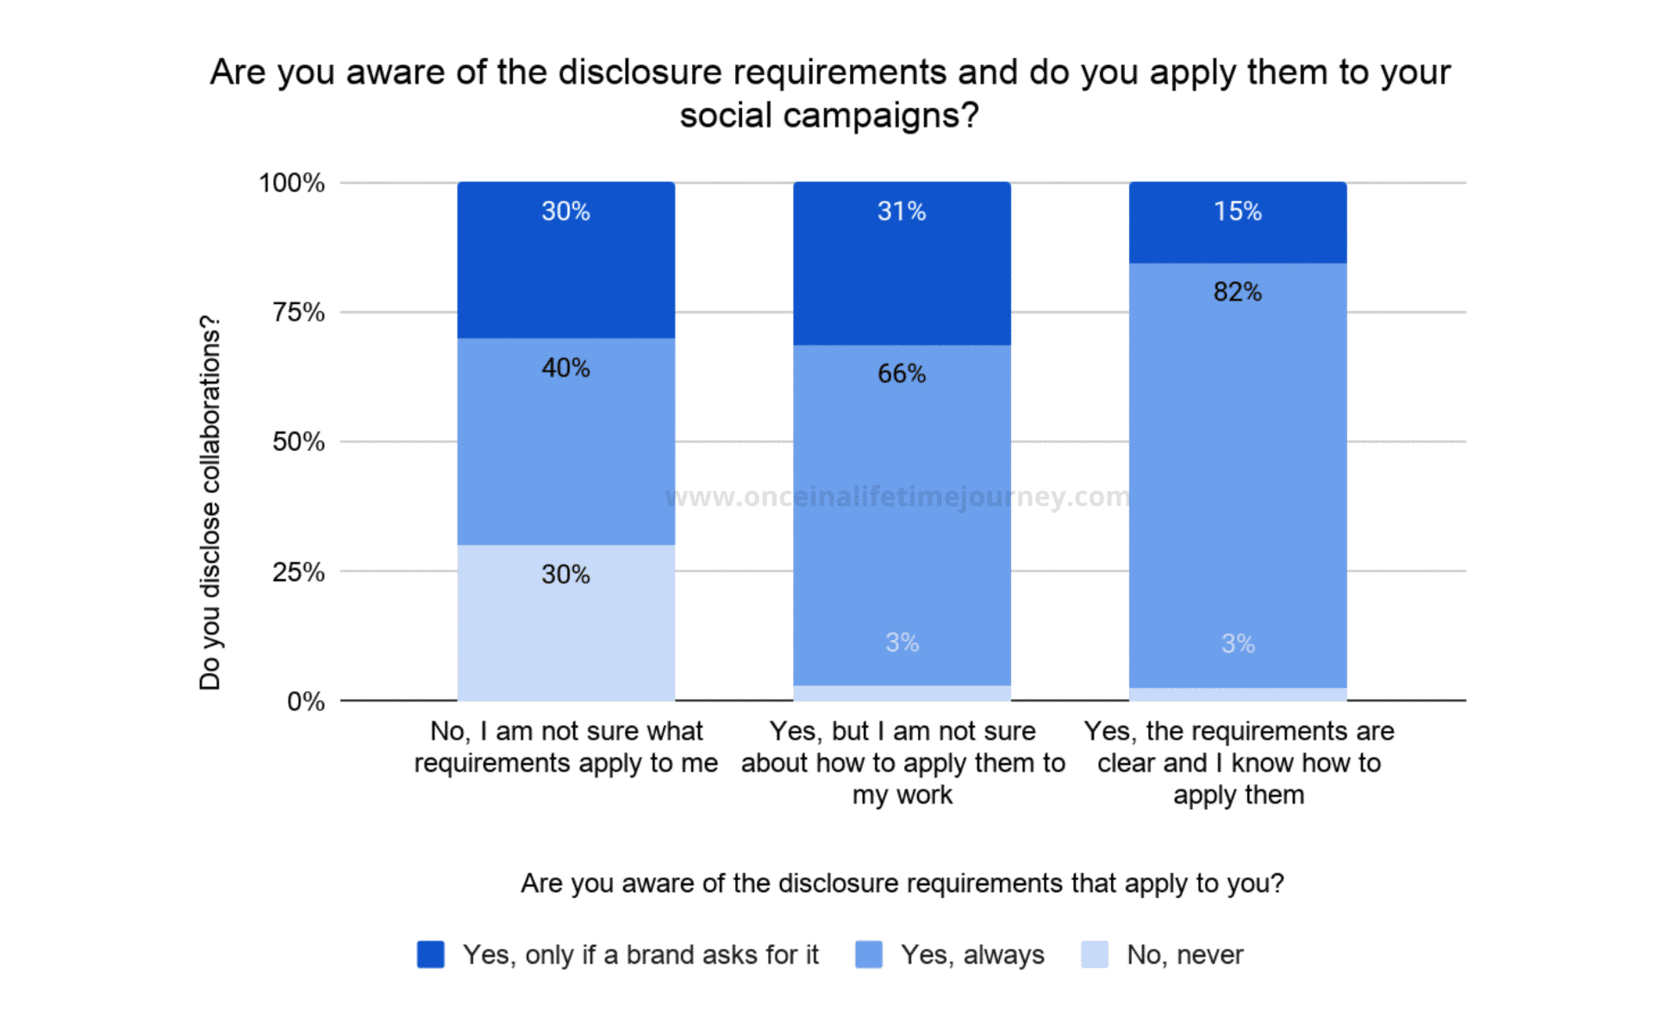
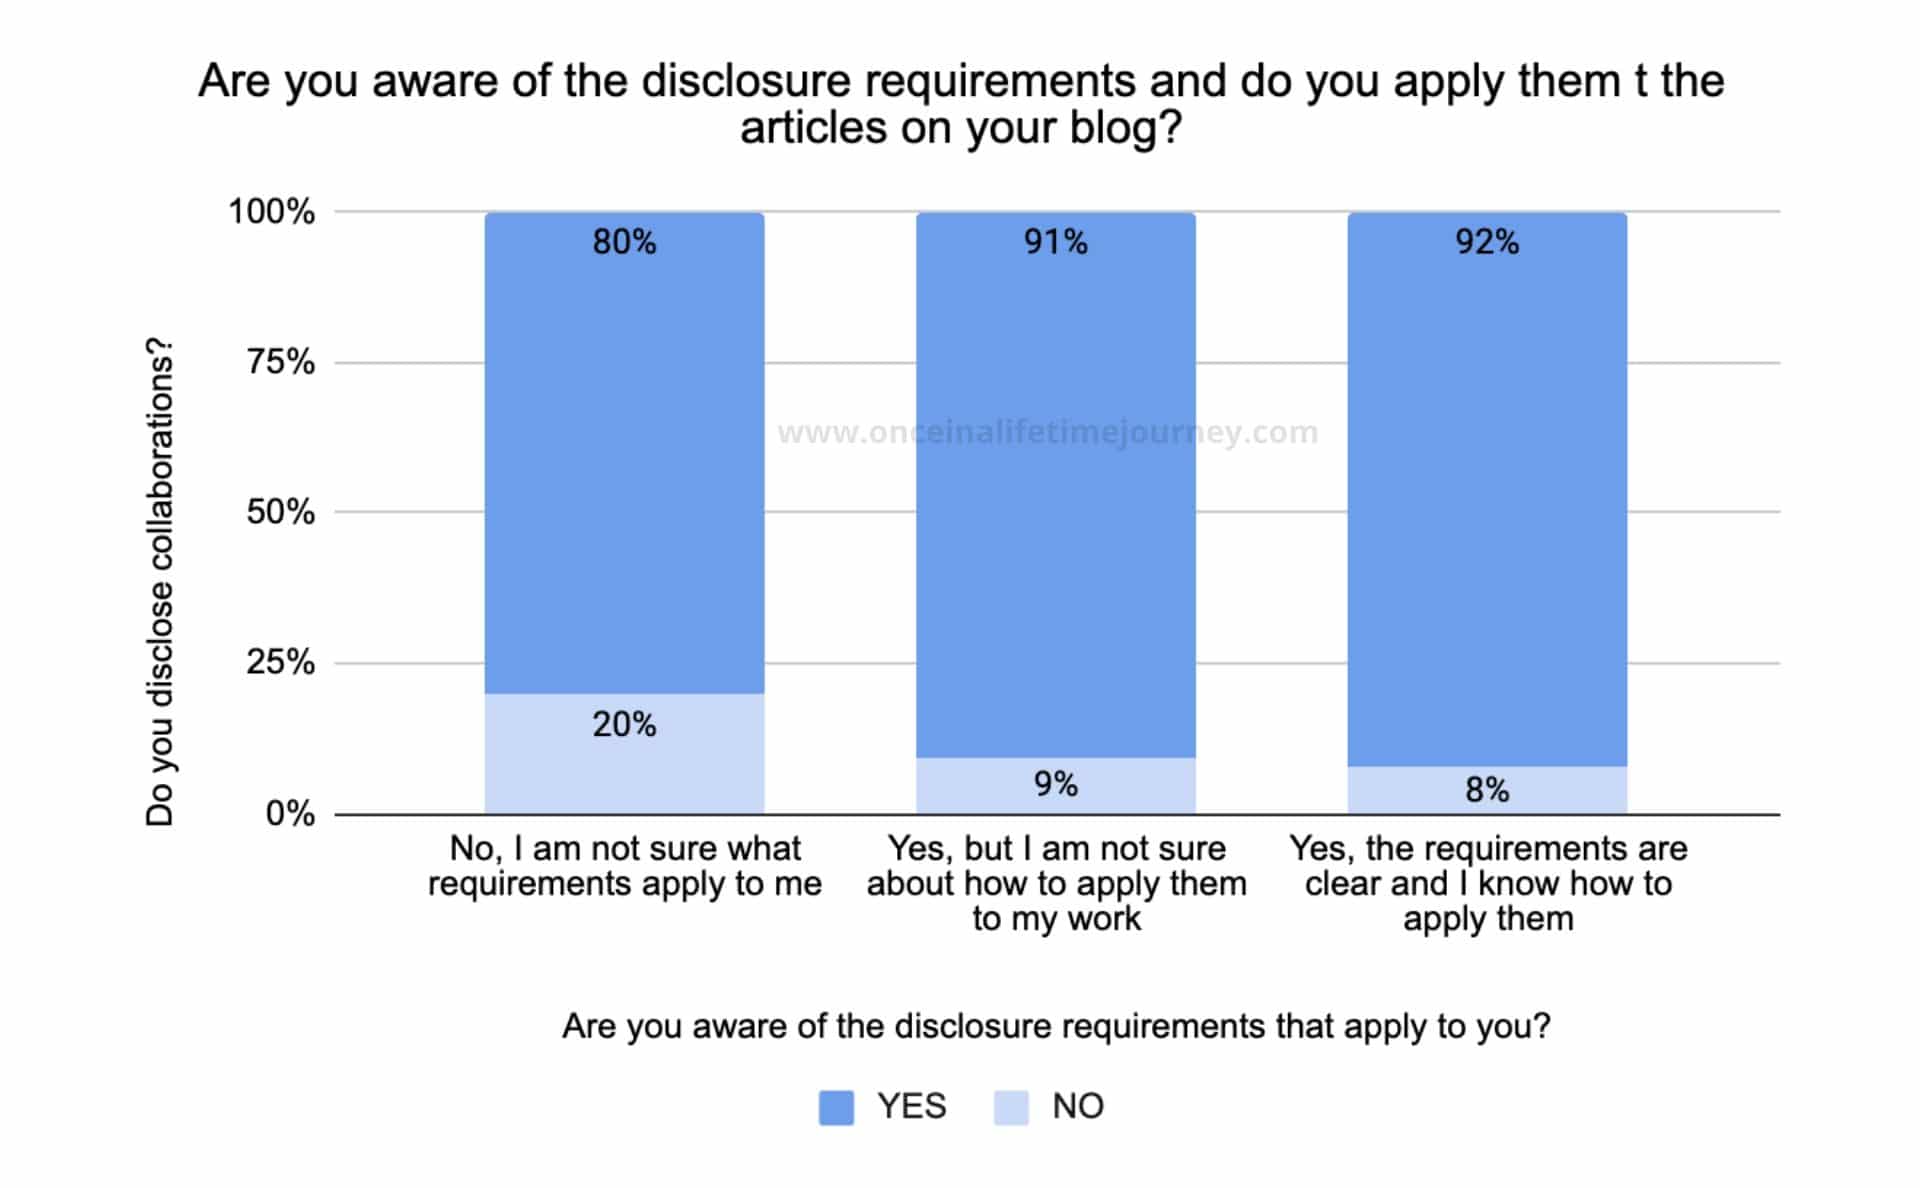
Content Creators who are aware of disclosures in social campaigns and on their blog
Interestingly, 15% of those who said they knew the disclosure requirements they had to comply with still did not apply them on social media campaigns unless a brand asked for it.
Furthermore, 31% of those who said they were not sure about how to apply also didn’t unless a brand asked for it.
Forward-looking view on the industry
To end the survey, we wanted to ask Content Creators for their view of the year that was ending as well as their outlook for the year to come. This is a sentiment-based question that will be interesting to track over time.
Level of dedication to the business
As the majority of our sample were full-time Content Creators, we wanted to understand if this was a sustainable trend.
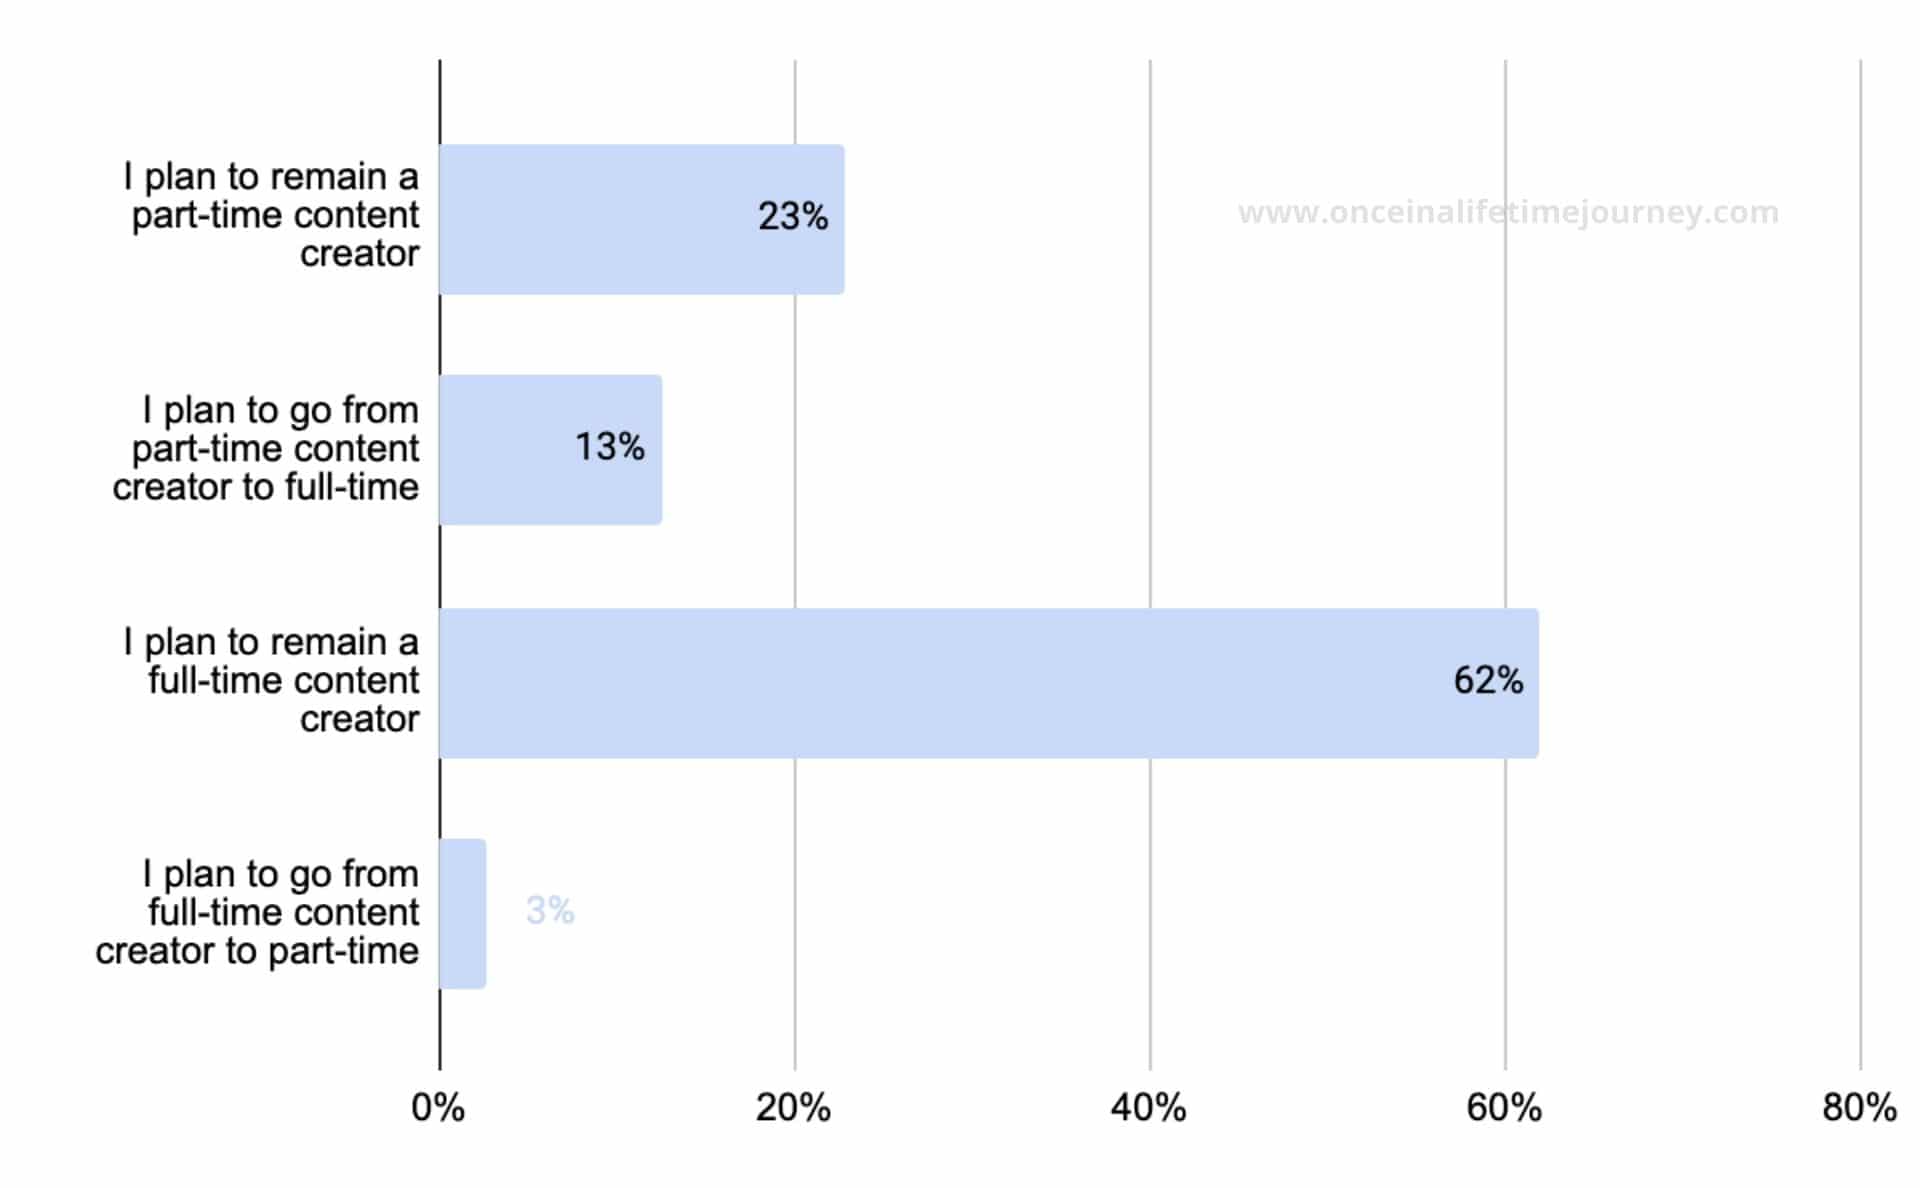
Most of our respondents planned to remain full-time Content Creators with a 23% planning to remain part-time creators and smaller percentages switching from one to the other.
How was 2019?
2019 saw the content creation industry become more sophisticated, developed and competitive.
Google’s various algorithm updates severely affected online publishers and Instagram’s many tests and changes also had an impact on social media Influencers and Content Creators.
It was a year of change, yet change is the only constant in this ever-changing industry.
So we asked several perception-driven questions aimed at capturing a sentiment. Firstly, about the level of competition.
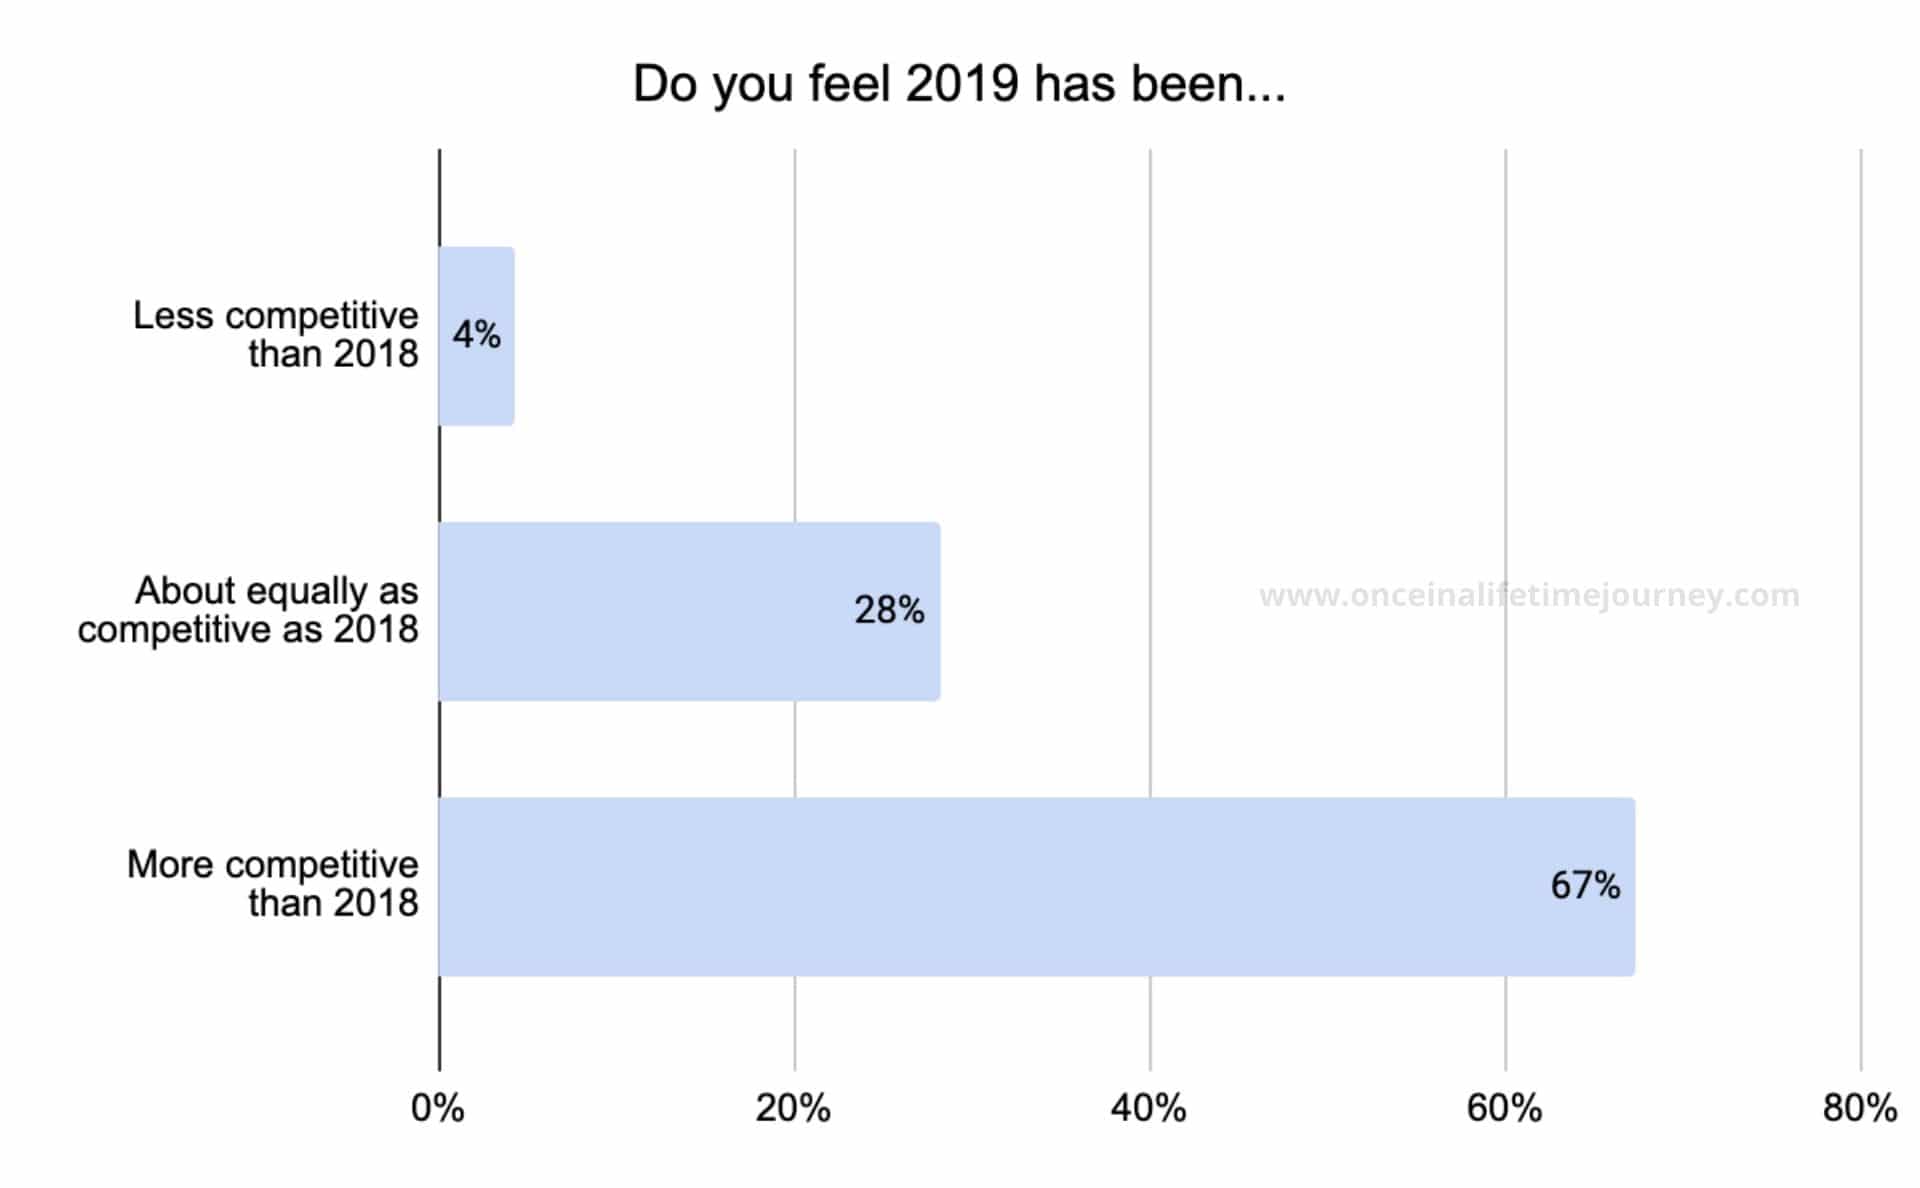
Like us, 67% of the respondents felt the industry was more competitive in 2019 than it was in 2018 and only 4% felt it was less competitive.
But did the increased levels of competition have an effect on revenues and traffic?
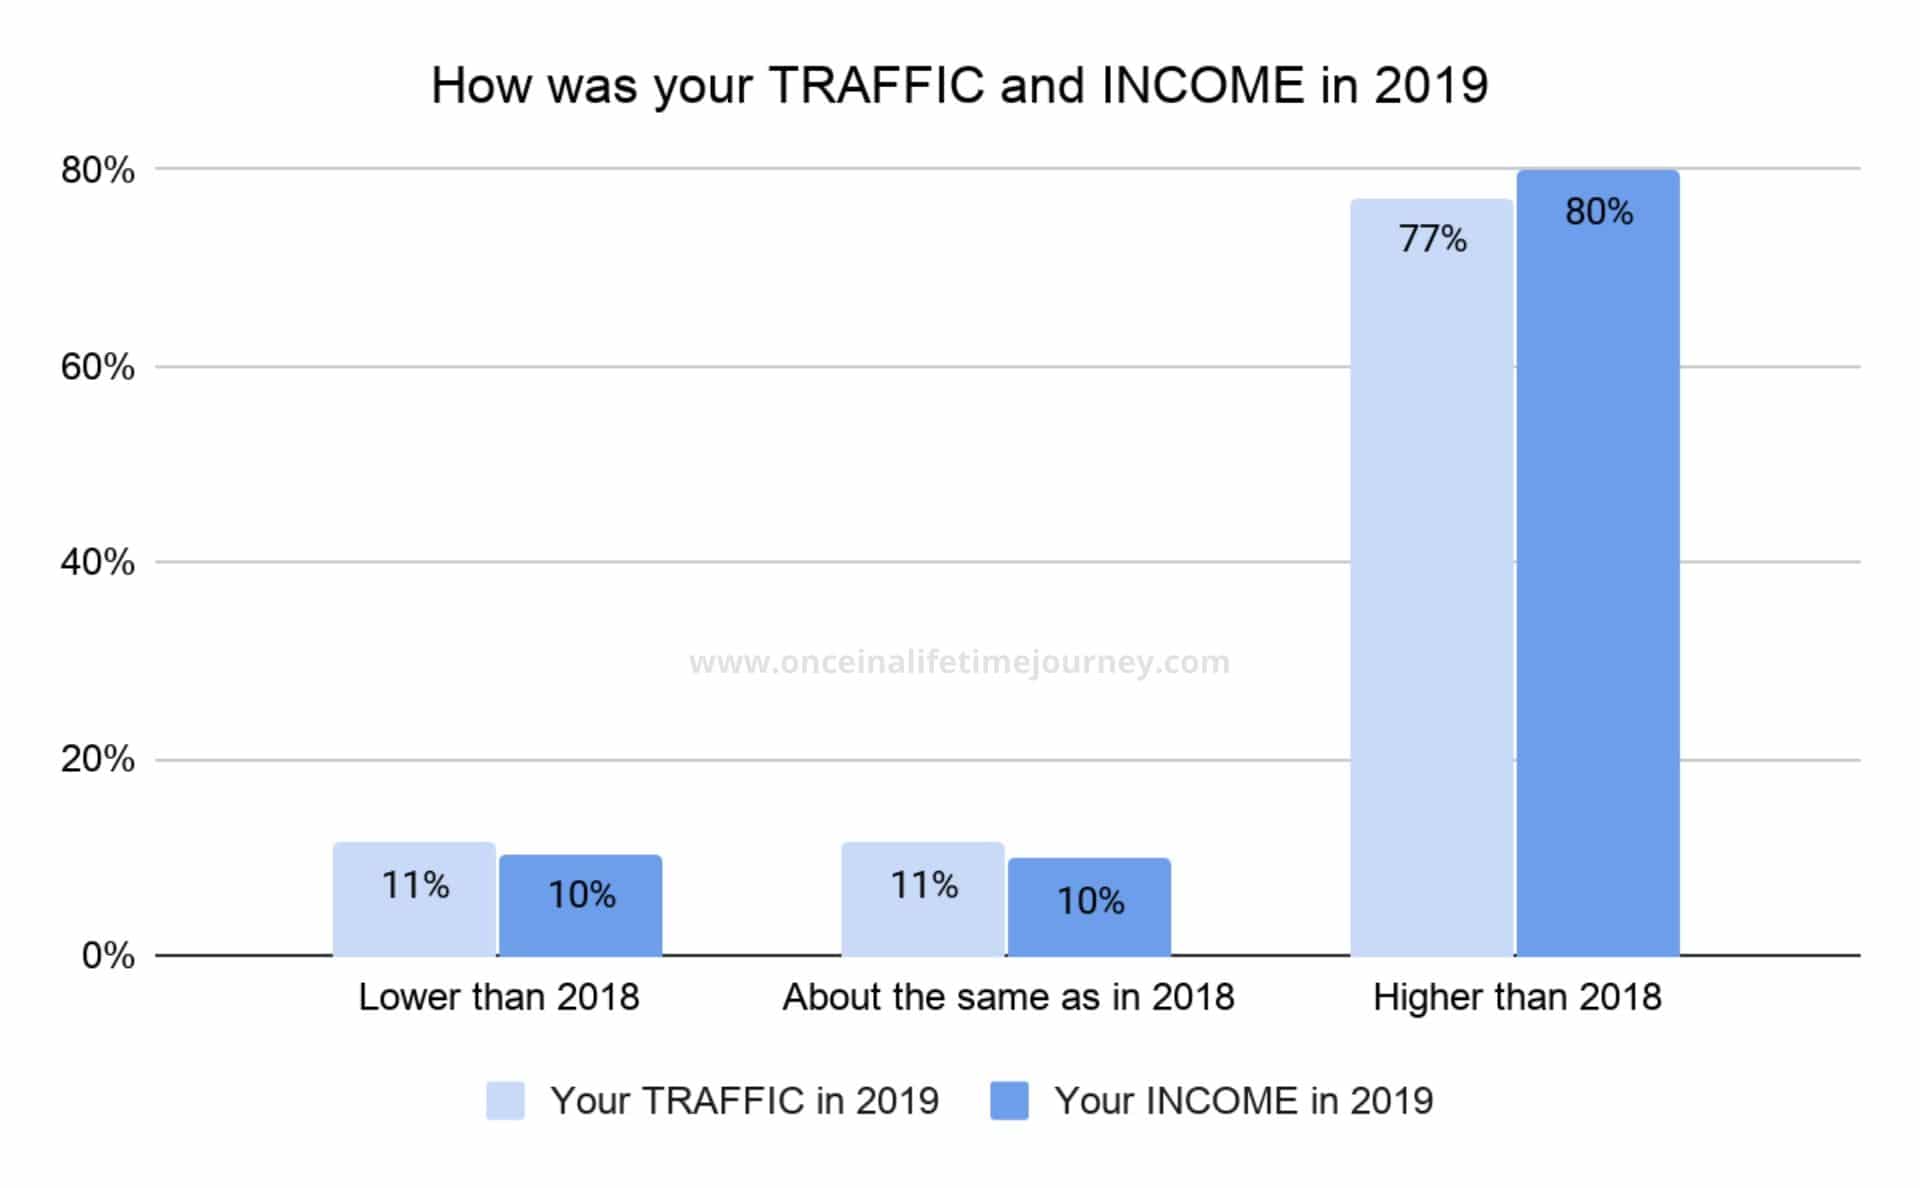
Despite the increased levels of competition, the vast majority of Content Creators saw 2019 as a much better year than 2018 in terms of both revenues and income.
Interactions with brands
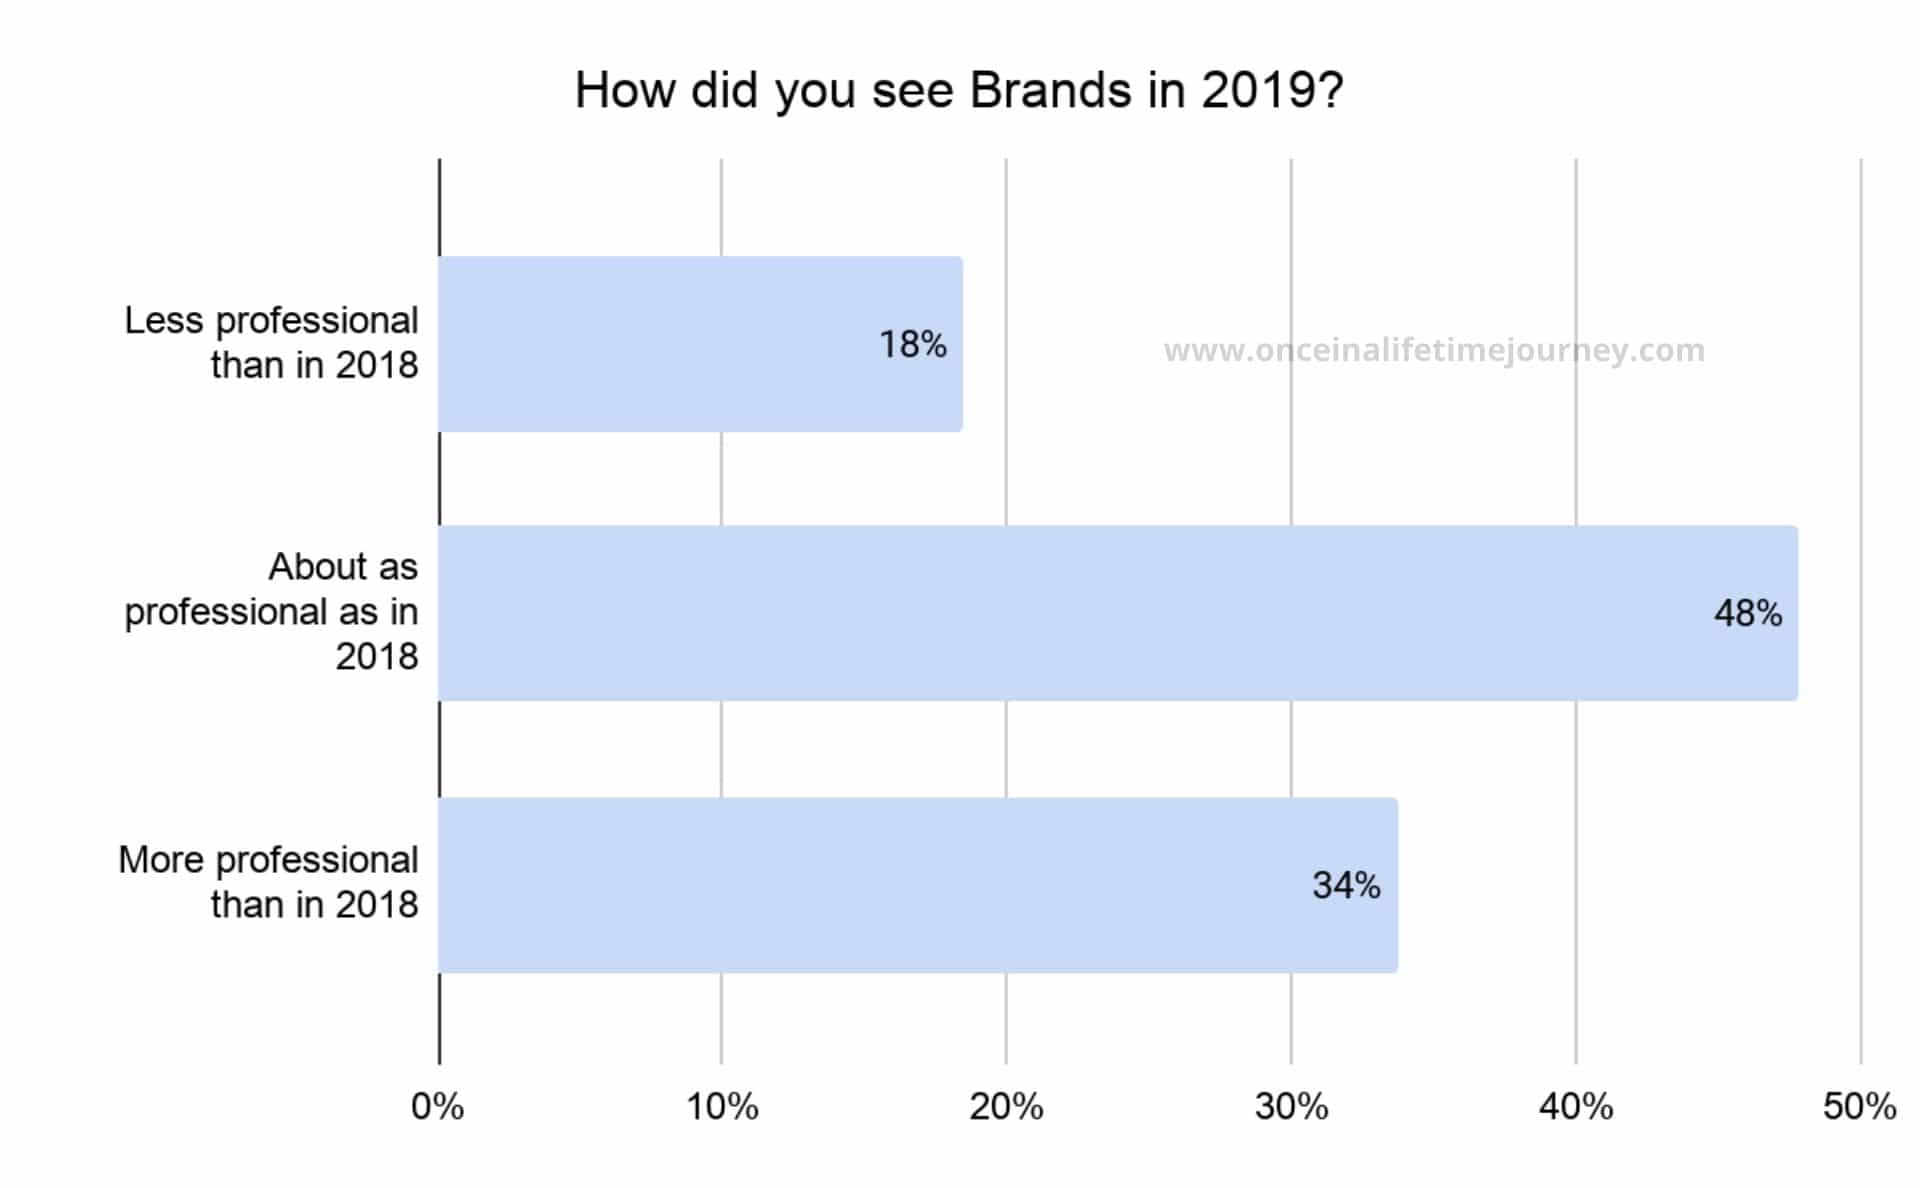
The professionalization of the industry has also meant an evolution of the interactions with brands who now have higher budgets but also more sophisticated tools, requirements and processes in place to work with Content Creators.
Have our sample respondents felt this evolution?
General outlook on the business
We ended the survey with two last sentiment questions: “How do you feel about your business in 2019?” and “How do you look towards 2020?”
These were subjective questions graded on a scale from 1 to 5 with 5 being “most optimistic”.
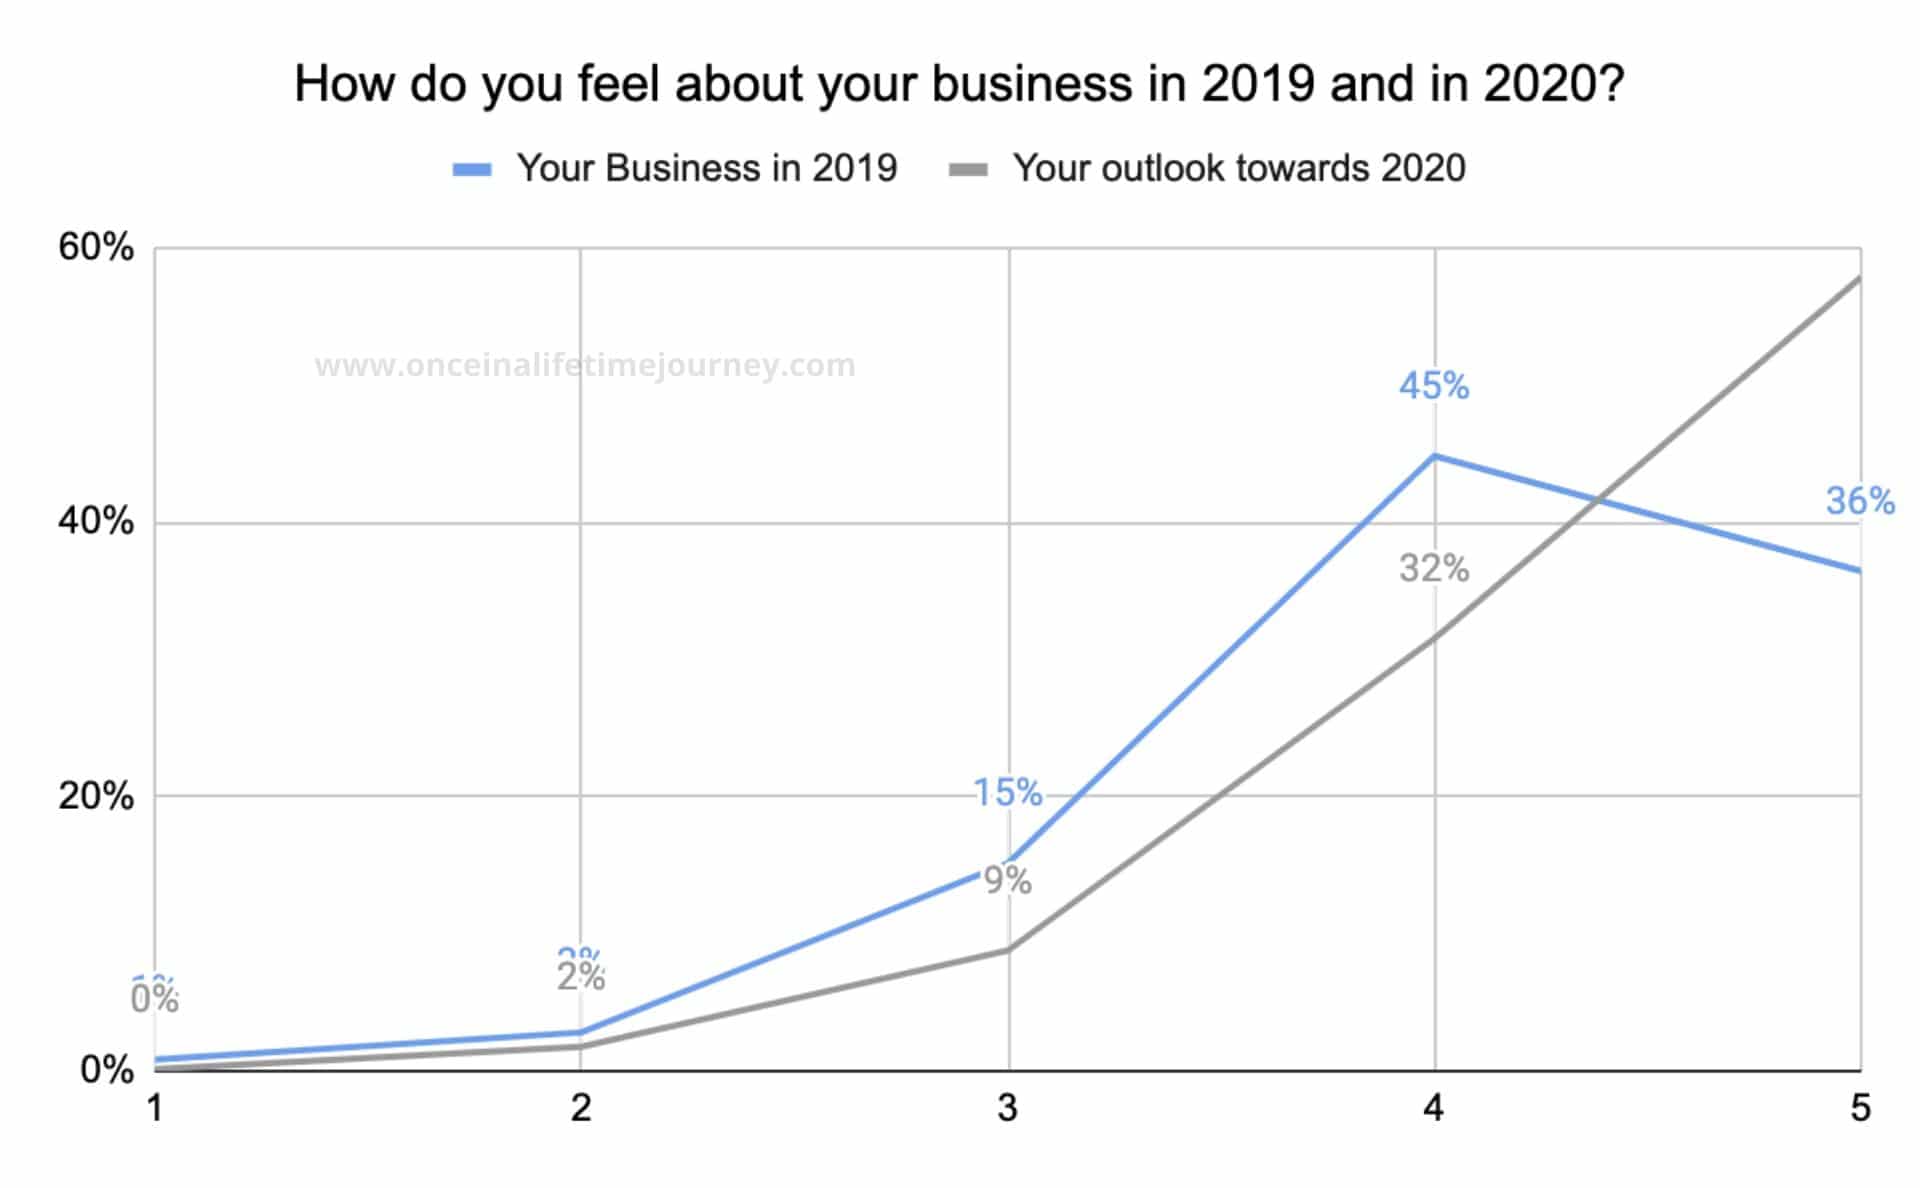
Our sample of Content Creators are tremendously optimistic about 2020, less so about their performance in 2019, facing the new year with renovated hope that it will be better than 2019.
Conclusion
“409 Million people view more than 20 billion pages every month” on WordPress alone, more than 1.7 billion websites in total. There is no doubt that the industry is becoming more competitive and more sophisticated.
What used to be a hobby for many (or an online diary) has become the main job title for many micro online entrepreneurs whoo are embracing the “Work anywhere” model and leaving often well-paid professional careers to make a living creating content online.
This increase in sophistication is giving way to new and ever-changing business models and is making it a very exciting industry where anything is possible.
While this constant change may be tiring and a deterrent for those who prefer a predictable industry, it is an exciting place where new ideas can take form and be tested. We hope that this does not change in 2020 as tried and tested revenue sources are incorporated and monthly revenues take new heights.
Appendix – Other fun facts
As data driven, ridiculously analytical people, there were also several data points that we found interesting but of little business value for the purpose of this article. We included them here.
Our survey was conducted under the premise that the individual responses would not be shared with anyone and that respondents could answer anonymously. However, 90% of the respondents provided their details.
This could be explained by the fact that the voucher provided by KAYAK Affiliate Network to the first 30 respondents could only be given to those who gave their email addresses, providing an incentive against anonymity.
The interesting fact is that 35% of the anonymous answers were from men (vs. the 16% overall male representation in the sample).